Wifi WLAN 5GHz trouble, Mikrotik, Bit rate tx 24 Mbit/s, 20-30 Mbit/s throughput

Dear community,

turris os: 3.9.1

I already analyzed and did troubleshooting for so many hours. My state is in minimum confused and probably desperated now.

I am an early adaptor of Turris Omnia. My goal is two support apporx 8 5 GHZ Clients with good data rates and approx 15 IoT devices in 2.4 GHz with lower data rates but in a wider area. At first I started with the Wifi-Version with the two integrated cards “WLE900VX + WLE200N2”. From day one I wasn’t happy with the performance + range. I read a post from @Tom here in the forum called: “High-performance configuration”. I switched the 2.4 GHZ and replaced it with the version “Mikrotik R11e-2HPnD” (ath9k). Good decision. I am quiet happy with it.

I changed the 5 GHz card with a Apple AirPort AR5BXB112 card. This one works with the ath9k driver. The card was quiet stable but I never got more performance as approx 30-40 Mbit/s (yes, Mbit/s). So I took the decision to buy the more expensive card which Tom recommended: Mikrotik R11e-5HacT (chipset: QCA9880).

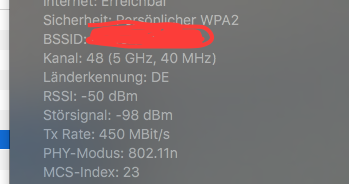
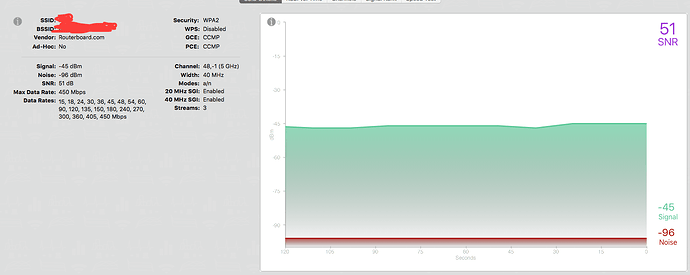
Since yesterday I am fighting with the configuration - I changed the firmware “ath10k-firmware-qca988x-ct” with “ath10k-firmware-qca988x” and vice versa. I checked (http://www.candelatech.com/downloads/) and (https://wireless.wiki.kernel.org/en/users/Drivers/ath10k/firmware) two get other firmware releases. But every time the same situation - I just get approx 20 - 30 Mbit/s (tested with many different clients with iperf, all the same result). What is going wrong here? I have good SNR and checked the plugs of the RP-SMA, MMCX plugs etc. No luck.

Please can someone give me a hint what can be the issue - maybe someone with the same hw-config can tell me which driver, firmware and config he or she is using? Any help is really appreciated.

What I do not understand:

  • Why do I have every time a bit rate of “Bit Rate: 6.0 MBit/s” in tx? (Already solved, see post below)

  • is the dmesg output (see below) really ok?

  • Why I can not modify the bit rate with iw dev wlan0

  • Which is the recommended firmware?

  • and most important: why I get such a disappointing throughput (see iperf below) :confused:

      \# ethtool -i wlan0
      driver: ath10k_pci
      version: 4.4.106-1e4a549d177ab3da12b2052
      firmware-version: 10.2.4-1.0-00029
      expansion-rom-version:
      bus-info: 0000:02:00.0
      supports-statistics: yes
      supports-test: no
      supports-eeprom-access: no
      supports-register-dump: no
      supports-priv-flags: no
    
      \# iwinfo wlan0 info
      wlan0     ESSID: "loom"
                Access Point: NN
                Mode: Master  Channel: 48 (5.240 GHz)
                Tx-Power: 20 dBm  Link Quality: 55/70
                Signal: -55 dBm  Noise: -103 dBm
                Bit Rate: 6.0 MBit/s
                Encryption: WPA2 PSK (CCMP)
                Type: nl80211  HW Mode(s): 802.11nac
                Hardware: 168C:003C 19B6:D03C [Generic MAC80211]
                TX power offset: unknown
                Frequency offset: unknown
                Supports VAPs: yes  PHY name: phy0
    
      \#cat /etc/config/wireless
    
      config wifi-device 'radio0'
     	option type 'mac80211'
     	option path 'platform/soc/soc:pcie-controller/pci0000:00/0000:00:02.0/0000:02:00.0'
     	option hwmode '11a'
     	list supported_rates '18000 24000 36000 48000 54000'
     	list basic_rate '18000 24000 54000'
     	option country 'DE'
     	option channel '48'
     	option htmode 'HT40'
     	option txpower '20'
    

(I already deleted and modified the supported rates and basic rates - no change).

\# lsmod | grep ath
ath                    17687  4 ath9k
ath10k_core           249463  1 ath10k_pci
ath10k_pci             31795  0
ath9k                  95849  0
ath9k_common           20059  1 ath9k
ath9k_hw              343525  2 ath9k
cfg80211              237273  5 ath9k
compat                 12364  6 ath9k
mac80211              431467  2 ath9k
md_mod                105308  6 multipath
multipath               5474  0

\#lspci -v
02:00.0 Network controller: Qualcomm Atheros QCA986x/988x 802.11ac Wireless Network Adapter
       	Subsystem: Device 19b6:d03c
       	Flags: bus master, fast devsel, latency 0, IRQ 120
       	Memory at e0000000 (64-bit, non-prefetchable) [size=2M]
       	Expansion ROM at e0200000 [disabled] [size=64K]
       	Capabilities: [40] Power Management version 2
       	Capabilities: [50] MSI: Enable+ Count=1/8 Maskable+ 64bit-
       	Capabilities: [70] Express Endpoint, MSI 00
       	Capabilities: [100] Advanced Error Reporting
       	Capabilities: [140] Virtual Channel
       	Capabilities: [160] Device Serial Number 00-00-00-00-00-00-00-00
       	Kernel driver in use: ath10k_pci

\#dmesg | grep ath
[   14.218842] md: multipath personality registered for level -4
[   14.576308] ath10k_pci 0000:02:00.0: pci irq msi oper_irq_mode 2 irq_mode 0 reset_mode 0
[   14.768172] ath10k_pci 0000:02:00.0: qca988x hw2.0 target 0x4100016c chip_id 0x043202ff sub 19b6:d03c
[   14.777452] ath10k_pci 0000:02:00.0: kconfig debug 0 debugfs 1 tracing 0 dfs 1 testmode 1
[   14.787050] ath10k_pci 0000:02:00.0: firmware ver 10.2.4-1.0-00029 api 5 features no-p2p,raw-mode,mfp,allows-mesh-bcast crc32 88595bb8
[   14.898046] ath10k_pci 0000:02:00.0: board id is not exist in otp, ignore it
[   14.905160] ath10k_pci 0000:02:00.0: Direct firmware load for ath10k/QCA988X/hw2.0/board-2.bin failed with error -2
[   14.915631] ath10k_pci 0000:02:00.0: Falling back to user helper
[   14.925321] firmware ath10k!QCA988X!hw2.0!board-2.bin: firmware_loading_store: map pages failed
[   14.935160] ath10k_pci 0000:02:00.0: board_file api 1 bmi_id N/A crc32 bebc7c08
[   15.041565] ath10k_pci 0000:02:00.0: board id is not exist in otp, ignore it
[   15.048631] ath10k_pci 0000:02:00.0: failed to get board id: -95
[   16.175257] ath10k_pci 0000:02:00.0: htt-ver 2.1 wmi-op 5 htt-op 2 cal otp max-sta 128 raw 0 hwcrypto 1
[   16.261021] ath: EEPROM regdomain: 0x0
[   16.261026] ath: EEPROM indicates default country code should be used
[   16.261029] ath: doing EEPROM country->regdmn map search
[   16.261033] ath: country maps to regdmn code: 0x3a
[   16.261036] ath: Country alpha2 being used: US
[   16.261038] ath: Regpair used: 0x3a
[   16.698309] ath: EEPROM regdomain: 0x0
[   16.698314] ath: EEPROM indicates default country code should be used
[   16.698316] ath: doing EEPROM country->regdmn map search
[   16.698320] ath: country maps to regdmn code: 0x3a
[   16.698323] ath: Country alpha2 being used: US
[   16.698325] ath: Regpair used: 0x3a
[   24.531042] ath10k_pci 0000:02:00.0: board id is not exist in otp, ignore it
[   24.538115] ath10k_pci 0000:02:00.0: failed to get board id: -95
[  687.081093] ath10k_pci 0000:02:00.0: could not get mac80211 beacon
[  687.398734] ath: EEPROM regdomain: 0x8114
[  687.398742] ath: EEPROM indicates we should expect a country code
[  687.398745] ath: doing EEPROM country->regdmn map search
[  687.398748] ath: country maps to regdmn code: 0x37
[  687.398751] ath: Country alpha2 being used: DE
[  687.398753] ath: Regpair used: 0x37
[  687.398757] ath: regdomain 0x8114 dynamically updated by user
[  687.398795] ath: EEPROM regdomain: 0x8114
[  687.398798] ath: EEPROM indicates we should expect a country code
[  687.398800] ath: doing EEPROM country->regdmn map search
[  687.398803] ath: country maps to regdmn code: 0x37
[  687.398805] ath: Country alpha2 being used: DE
[  687.398808] ath: Regpair used: 0x37
[  687.398810] ath: regdomain 0x8114 dynamically updated by user
[  688.699762] ath10k_pci 0000:02:00.0: board id is not exist in otp, ignore it
[  688.706835] ath10k_pci 0000:02:00.0: failed to get board id: -95
[  824.178644] ath10k_pci 0000:02:00.0: board id is not exist in otp, ignore it
[  824.185734] ath10k_pci 0000:02:00.0: failed to get board id: -95

Try change bit rate with “iw dev wlan0 set bitrates legacy-5 ht-mcs-5 8 vht-mcs-5” -> no change.

\# iw phy0 info
Wiphy phy0
       	max # scan SSIDs: 16
       	max scan IEs length: 199 bytes
       	Retry short limit: 7
       	Retry long limit: 4
       	Coverage class: 0 (up to 0m)
       	Device supports AP-side u-APSD.
       	Available Antennas: TX 0x7 RX 0x7
       	Configured Antennas: TX 0x7 RX 0x7
       	Supported interface modes:
       		 * managed
       		 * AP
       		 * AP/VLAN
       		 * monitor
       		 * mesh point
       	Band 2:
       		Capabilities: 0x19ef
       			RX LDPC
       			HT20/HT40
       			SM Power Save disabled
       			RX HT20 SGI
       			RX HT40 SGI
       			TX STBC
       			RX STBC 1-stream
       			Max AMSDU length: 7935 bytes
       			DSSS/CCK HT40
       		Maximum RX AMPDU length 65535 bytes (exponent: 0x003)
       		Minimum RX AMPDU time spacing: 8 usec (0x06)
       		HT TX/RX MCS rate indexes supported: 0-23
       		VHT Capabilities (0x338001b2):
       			Max MPDU length: 11454
       			Supported Channel Width: neither 160 nor 80+80
       			RX LDPC
       			short GI (80 MHz)
       			TX STBC
       			RX antenna pattern consistency
       			TX antenna pattern consistency
       		VHT RX MCS set:
       			1 streams: MCS 0-9
       			2 streams: MCS 0-9
       			3 streams: MCS 0-9
       			4 streams: not supported
       			5 streams: not supported
       			6 streams: not supported
       			7 streams: not supported
       			8 streams: not supported
       		VHT RX highest supported: 0 Mbps
       		VHT TX MCS set:
       			1 streams: MCS 0-9
       			2 streams: MCS 0-9
       			3 streams: MCS 0-9
       			4 streams: not supported
       			5 streams: not supported
       			6 streams: not supported
       			7 streams: not supported
       			8 streams: not supported
       		VHT TX highest supported: 0 Mbps
       		Frequencies:
       			* 5180 MHz [36] (20.0 dBm)
       			* 5200 MHz [40] (20.0 dBm)
       			* 5220 MHz [44] (20.0 dBm)
       			* 5240 MHz [48] (20.0 dBm)
       			* 5260 MHz [52] (20.0 dBm) (radar detection)
       			  DFS state: usable (for 2848 sec)
       			  DFS CAC time: 60000 ms
       			* 5280 MHz [56] (20.0 dBm) (radar detection)
       			  DFS state: usable (for 2848 sec)
       			  DFS CAC time: 60000 ms
       			* 5300 MHz [60] (20.0 dBm) (radar detection)
       			  DFS state: usable (for 2848 sec)
       			  DFS CAC time: 60000 ms
       			* 5320 MHz [64] (20.0 dBm) (radar detection)
       			  DFS state: usable (for 2848 sec)
       			  DFS CAC time: 60000 ms
       			* 5500 MHz [100] (27.0 dBm) (radar detection)
       			  DFS state: usable (for 2848 sec)
       			  DFS CAC time: 60000 ms
       			* 5520 MHz [104] (27.0 dBm) (radar detection)
       			  DFS state: usable (for 2848 sec)
       			  DFS CAC time: 60000 ms
       			* 5540 MHz [108] (27.0 dBm) (radar detection)
       			  DFS state: usable (for 2848 sec)
       			  DFS CAC time: 60000 ms
       			* 5560 MHz [112] (27.0 dBm) (radar detection)
       			  DFS state: usable (for 2848 sec)
       			  DFS CAC time: 60000 ms
       			* 5580 MHz [116] (27.0 dBm) (radar detection)
       			  DFS state: usable (for 2848 sec)
       			  DFS CAC time: 60000 ms
       			* 5600 MHz [120] (27.0 dBm) (radar detection)
       			  DFS state: usable (for 2848 sec)
       			  DFS CAC time: 60000 ms
       			* 5620 MHz [124] (27.0 dBm) (radar detection)
       			  DFS state: usable (for 2848 sec)
       			  DFS CAC time: 60000 ms
       			* 5640 MHz [128] (27.0 dBm) (radar detection)
       			  DFS state: usable (for 2848 sec)
       			  DFS CAC time: 60000 ms
       			* 5660 MHz [132] (27.0 dBm) (radar detection)
       			  DFS state: usable (for 2848 sec)
       			  DFS CAC time: 60000 ms
       			* 5680 MHz [136] (27.0 dBm) (radar detection)
       			  DFS state: usable (for 2848 sec)
       			  DFS CAC time: 60000 ms
       			* 5700 MHz [140] (27.0 dBm) (radar detection)
       			  DFS state: usable (for 2848 sec)
       			  DFS CAC time: 60000 ms
       			* 5720 MHz [144] (disabled)
       			* 5745 MHz [149] (14.0 dBm)
       			* 5765 MHz [153] (14.0 dBm)
       			* 5785 MHz [157] (14.0 dBm)
       			* 5805 MHz [161] (14.0 dBm)
       			* 5825 MHz [165] (14.0 dBm)
       			* 5845 MHz [169] (14.0 dBm)
       	valid interface combinations:
       		 * #{ AP, mesh point } <= 8, #{ managed } <= 1,
       		   total <= 8, #channels <= 1, STA/AP BI must match, radar detect widths: { 20 MHz (no HT), 20 MHz, 40 MHz, 80 MHz }

\## iw reg get
country DE: DFS-ETSI
       	(2400 - 2483 @ 40), (N/A, 20), (N/A)
       	(5150 - 5250 @ 80), (N/A, 20), (N/A), NO-OUTDOOR
       	(5250 - 5350 @ 80), (N/A, 20), (0 ms), NO-OUTDOOR, DFS
       	(5470 - 5725 @ 160), (N/A, 27), (0 ms), DFS
       	(5725 - 5875 @ 80), (N/A, 14), (N/A)
       	(57000 - 66000 @ 2160), (N/A, 40), (N/A)

Thank you,

dmq
Well are you sure you did not damaged diplexers and connectors when exchanging and trying the cards ? It is very fragile parts. The wires are not actually wires but waveguides so if you bend it to fracture it could be the problem.

Thanks for the fast response.

Well I am not sure but I changed it very cautious. Which diplexers and connectros do you mean exactly - on the card or on the board?

Ah, you mean the signal-divider. No I do not use them any more.

1 Like

Regarding the bit rate (6 Mbit/s) on ath10k: as @adminX pointed out in a few posts, it seems to be the normal state becau se the hardware/firmware does not report the actual rate to the OS kernel (adminX: “The ath10k run this in firmware and does not notify the kernel of the used transmit rate.”).

Instead actual values can be checked here: /sys/kernel/debug/ieee80211/phyX/ath10k/fw_stats

#cd /sys/kernel/debug/ieee80211/phy0/ath10k && cat fw_stats

                 ath10k PDEV stats
                 =================

               Channel noise floor       -104
                  Channel TX power         40
                    TX frame count  312394719
                    RX frame count   36696643
                    RX clear count  366108561
                       Cycle count 2422911057
                   PHY error count          0
                     RTS bad count      55318
                    RTS good count      21077
                     FCS bad count       4734
                   No beacon count          0
                     MIB int count          2


              ath10k PDEV TX stats
                 =================

                HTT cookies queued     664587
                 HTT cookies disp.     664587
                       MSDU queued     988081
                       MPDU queued     988081
                     MSDUs dropped        759
                      Local enqued     324192
                       Local freed     324192
                         HW queued    1015766
                      PPDUs reaped    1015765
                     Num underruns          0
                     PPDUs cleaned         24
                      MPDUs requed      27991
                 Excessive retries      30570
                           HW rate          1
                Sched self tiggers          0
         Dropped due to SW retries          0
           Illegal rate phy errors          0
            Pdev continuous xretry        386
                        TX timeout          0
                       PDEV resets        389
                      PHY underrun          0
      MPDU is more than txop limit          0

              ath10k PDEV RX stats
                 =================

             Mid PPDU route change          0
           Tot. number of statuses     396258
            Extra frags on rings 0          0
            Extra frags on rings 1          0
            Extra frags on rings 2          0
            Extra frags on rings 3          0
            MSDUs delivered to HTT     396258
            MPDUs delivered to HTT     396258
          MSDUs delivered to stack      25763
          MPDUs delivered to stack      25763
                   Oversized AMSUs          0
                        PHY errors       4930
                  PHY errors drops          0
       MPDU errors (FCS, MIC, ENC)       4164

                 ath10k VDEV stats (0)
                 =================


                 ath10k PEER stats (2)
                 =================

                  Peer MAC address de:ad:be:ef:ca:fe
                         Peer RSSI 39
                      Peer TX rate 24000
                      Peer RX rate 54000
                  Peer RX duration 0

                  Peer MAC address de:ad:be:ef:ca:fe
                         Peer RSSI 48
                      Peer TX rate 24000
                      Peer RX rate 450000
                  Peer RX duration 26308

Has someone an idea why there is a Peer TX rate of 24000? In this network are no Stations with lower RX rates than 54000.

I tried to change it:

iw dev wlan0 set bitrates legacy-5 ht-mcs-5 0 vht-mcs-5

As often: no change :frowning:

Here are some state from the client:

#iperf -s
------------------------------------------------------------
Server listening on TCP port 5001
TCP window size: 85.3 KByte (default)
------------------------------------------------------------
[  4] local AA.23.FF.1 port 5001 connected with AA.23.FF.253 port 59936
[ ID] Interval       Transfer     Bandwidth
[  4]  0.0-10.0 sec  31.6 MBytes  26.4 Mbits/sec

Direction change: AP->STA

iperf -c AA.23.FF.253
------------------------------------------------------------
Client connecting to AA.23.FF.253, TCP port 5001
TCP window size: 43.8 KByte (default)
------------------------------------------------------------
[  3] local AA.23.FF.1 port 52062 connected with AA.23.FF.253 port 5001
[ ID] Interval       Transfer     Bandwidth
[  3]  0.0-10.1 sec  9.00 MBytes  7.45 Mbits/sec

Same client - view of turris:

# iw dev wlan0 station dump
Station AA.23.FF (on wlan0)
       	inactive time: 	0 ms
       	rx bytes:      	66220304
       	rx packets:    	325251
       	tx bytes:      	699568327
       	tx packets:    	491842
       	tx retries:    	0
       	tx failed:     	2613
       	signal:        	-46 dBm
       	signal avg:    	-46 dBm
       	tx bitrate:    	6.0 MBit/s
       	rx bitrate:    	450.0 MBit/s MCS 23 40MHz short GI
       	authorized:    	yes
       	authenticated: 	yes
       	preamble:      	long
       	WMM/WME:       	no
       	MFP:   		no
       	TDLS peer:     	no

I don’t know what is going here. I am currently thinking to give up but I invested so much time and money here. Sad. I am so far away from a high performance configuration.

Another info: I use all firmware-releases with the kernel module “kmod-ath10k”. With the kernel module “kmod-ath10k-ct” I get the following errors and the interface is not available:

[   19.827252] ath10k_core: Unknown symbol ath10k_thermal_event_temperature (err 0)
[   19.897333] ath10k_core: Unknown symbol ath10k_thermal_unregister (err 0)
[   19.904302] ath10k_core: Unknown symbol ath10k_thermal_register (err 0)
[   19.910990] ath10k_core: Unknown symbol ath10k_thermal_set_throttling (err 0)
[   19.918181] ath10k_core: Unknown symbol ath10k_thermal_event_temperature (err 0)
[   19.987690] ath10k_core: Unknown symbol ath10k_thermal_unregister (err 0)
[   19.994658] ath10k_core: Unknown symbol ath10k_thermal_register (err 0)
[   20.001354] ath10k_core: Unknown symbol ath10k_thermal_set_throttling (err 0)
[   20.008545] ath10k_core: Unknown symbol ath10k_thermal_event_temperature (err 0)

I switched the firmware one more time: I am now on the newest candela nc use level. This time the bitrate is at 54000 and I get slightly better performance. All of the stations are 11n or 11ac capable. The bitrate is not getting modified on use.

If no one ist interested or can’t help: does someone has possibly an advise, where I can ask for more help? At the moment I am thinking of selling my Mikrotik card and switch to my old wifi solution.

Thanks.

ethtool -i wlan0
driver: ath10k_pci
version: 4.4.106-1e4a549d177ab3da12b2052
firmware-version: 10.1-ct-8x-__xtW-020-9fa03e1
expansion-rom-version:
bus-info: 0000:02:00.0
supports-statistics: yes
supports-test: no
supports-eeprom-access: no
supports-register-dump: no
supports-priv-flags: no

cd /sys/kernel/debug/ieee80211/phy0/ath10k && cat fw_stats

             ath10k PDEV stats
             =================

           Channel noise floor       -102
              Channel TX power         50
                TX frame count    7443560
                RX frame count    3183483
                RX clear count   12284966
                   Cycle count 2180846760
               PHY error count          0
                 RTS bad count        159
                RTS good count         28
                 FCS bad count        154
               No beacon count        159
                 MIB int count          0


          ath10k PDEV TX stats
             =================

            HTT cookies queued      10946
             HTT cookies disp.      10946
                   MSDU queued      12974
                   MPDU queued      12974
                 MSDUs dropped          0
                  Local enqued       2028
                   Local freed       2028
                     HW queued      12992
                  PPDUs reaped      12992
                 Num underruns          0
                 PPDUs cleaned          0
                  MPDUs requed         18
             Excessive retries         19
                       HW rate          4
            Sched self tiggers          0
     Dropped due to SW retries          0
       Illegal rate phy errors          0
        Pdev continuous xretry          0
                    TX timeout          0
                   PDEV resets          1
                  PHY underrun          0
  MPDU is more than txop limit          0

          ath10k PDEV RX stats
             =================

         Mid PPDU route change          0
       Tot. number of statuses      18967
        Extra frags on rings 0          0
        Extra frags on rings 1          0
        Extra frags on rings 2          0
        Extra frags on rings 3          0
        MSDUs delivered to HTT      18967
        MPDUs delivered to HTT      18967
      MSDUs delivered to stack        360
      MPDUs delivered to stack        360
               Oversized AMSUs          0
                    PHY errors        352
              PHY errors drops          0
   MPDU errors (FCS, MIC, ENC)        144

             ath10k VDEV stats (0)
             =================


             ath10k PEER stats (3)
             =================

              Peer MAC address 01:00:00:00:4c:5e
                     Peer RSSI 49407
                  Peer TX rate 0
                  Peer RX rate 6000
              Peer RX duration 0

              Peer MAC address cc:44:63:a4:b0:e1
                     Peer RSSI 0
                  Peer TX rate 54000
                  Peer RX rate 0
              Peer RX duration 0

              Peer MAC address e4:ce:8f:68:3f:c0
                     Peer RSSI 0
                  Peer TX rate 54000
                  Peer RX rate 0
              Peer RX duration 0


------------------------------------------------------------
Server listening on TCP port 5001
TCP window size: 85.3 KByte (default)
------------------------------------------------------------
[  4] local NN.MM.OO.1 port 5001 connected with NN.MM.OO.253 port 63742
[ ID] Interval       Transfer     Bandwidth
[  4]  0.0-100.0 sec   549 MBytes  46.1 Mbits/sec


/sys/kernel/debug/ieee80211/phy0/ath10k# iw dev wlan0 station dump
Station :cut:turrs (on wlan0)
       	inactive time: 	120 ms
       	rx bytes:      	14359
       	rx packets:    	256
       	tx bytes:      	7628
       	tx packets:    	62
       	tx retries:    	0
       	tx failed:     	0
       	signal:        	-63 dBm
       	signal avg:    	-63 dBm
       	tx bitrate:    	6.0 MBit/s
       	rx bitrate:    	54.0 MBit/s
       	authorized:    	yes
       	authenticated: 	yes
       	preamble:      	long
       	WMM/WME:       	no
       	MFP:   		no
       	TDLS peer:     	no
Station :cut:sta1 (on wlan0)
       	inactive time: 	0 ms
       	rx bytes:      	25180690
       	rx packets:    	22167
       	tx bytes:      	3589492
       	tx packets:    	13232
       	tx retries:    	0
       	tx failed:     	0
       	signal:        	-47 dBm
       	signal avg:    	-45 dBm
       	tx bitrate:    	6.0 MBit/s
       	rx bitrate:    	450.0 MBit/s MCS 23 40MHz short GI
       	authorized:    	yes
       	authenticated: 	yes
       	preamble:      	long
       	WMM/WME:       	no
       	MFP:   		no
       	TDLS peer:     	no

Happy new year.

Just a side note: I’ve got the same situation with the stock WLE900VX card.

Just for you to know. We tried to use candelatech drivers about a year ago because users complained that our wifi is under performed. Everything seemed fine, our tests shown promise. But when we deployed it to production it all went to s***. Some users call it now wifigate. So our experience is that those drives has better performance but has some severe problems with stability. Of course it was more than one year ago so situation could change. But of course you are free to continue in your tests. We had little bit PR nightmare on our hands so we reverted as fast as possible and never went back. So we haven’t put up too much manpower to debugging what was going on. So there is chance that you might found out cause of those problems.

Thanks for the information cynerd. I did not recognize stability problems. But even if my environment is quiet divers it is not comparable to real world. At the moment I revert back to the standard drivers. Candeltech performs slightly better but this is not my main issue. But I would be glad if I could help others.

There are users in the forum like @flo which have a similar test environment like me but totally different performance metrics.

Flos iperf rating: WiFi radio test

I tried different pigtails, antennas and cards. I do not need the last Mbit/s to get an top rating in comparison to other vendors or projects. I just want rational numbers.

Thanks.

Hi,
I’ll take the right thread now, hre is my config with connected clients:

root@Turris-Omnia:/sys/kernel/debug/ieee80211/phy0/ath10k# cd /sys/kernel/debug/ieee80211/phy0/ath10k && cat fw_stats

         ath10k PDEV stats
         =================

       Channel noise floor       -103
          Channel TX power         46
            TX frame count   35839658
            RX frame count   98281067
            RX clear count  147855232
               Cycle count 3579580547
           PHY error count       3320
             RTS bad count    6816114
            RTS good count  479492105
             FCS bad count  748229011
           No beacon count          0
             MIB int count      32897


      ath10k PDEV TX stats
         =================

        HTT cookies queued    1583466
         HTT cookies disp.    1583466
               MSDU queued    2162789
               MPDU queued    1924915
             MSDUs dropped          0
              Local enqued     579323
               Local freed     579323
                 HW queued    1854525
              PPDUs reaped    1854525
             Num underruns          0
             PPDUs cleaned          0
              MPDUs requed      97978
         Excessive retries      57152
                   HW rate        216
        Sched self tiggers        577
 Dropped due to SW retries          0
   Illegal rate phy errors          0
    Pdev continuous xretry          0
                TX timeout          0
               PDEV resets          3
              PHY underrun          0
   MPDU is more than txop limit          0

      ath10k PDEV RX stats
         =================

     Mid PPDU route change         24
   Tot. number of statuses    2859303
    Extra frags on rings 0          0
    Extra frags on rings 1        204
    Extra frags on rings 2        241
    Extra frags on rings 3          0
    MSDUs delivered to HTT    2859303
    MPDUs delivered to HTT    2859302
  MSDUs delivered to stack    1778047
  MPDUs delivered to stack    1778047
           Oversized AMSUs          0
                PHY errors   15156030
          PHY errors drops       3285
   MPDU errors (FCS, MIC, ENC)     100528

         ath10k VDEV stats (0)
         =================


         ath10k PEER stats (3)
         =================

          Peer MAC address 4c:5e:0c:13:ff:ac
                 Peer RSSI 0
              Peer TX rate 0
              Peer RX rate 0
          Peer RX duration 0

          Peer MAC address 5c:51:4f:47:9d:9d
                 Peer RSSI 35
              Peer TX rate 780000
              Peer RX rate 650000
          Peer RX duration 0

          Peer MAC address 80:01:84:d6:4f:fb
                 Peer RSSI 55
              Peer TX rate 433300
              Peer RX rate 6000
          Peer RX duration 0

here is my dmesg output:

[   14.504919] pci 0000:00:01.0: enabling device (0140 -> 0142)
[   14.510837] ath10k_pci 0000:01:00.0: pci irq msi oper_irq_mode 2 irq_mode 0 reset_mode 0  
[   14.683298] ath10k_pci 0000:01:00.0: Direct firmware load for ath10k/pre-cal-pci-0000:01:00.0.bin failed with error -2
[   14.694032] ath10k_pci 0000:01:00.0: Falling back to user helper
[   14.703770] firmware ath10k!pre-cal-pci-0000:01:00.0.bin: firmware_loading_store: map pages failed
[   14.712896] ath10k_pci 0000:01:00.0: Direct firmware load for ath10k/cal-pci-0000:01:00.0.bin failed with error -2
[   14.723286] ath10k_pci 0000:01:00.0: Falling back to user helper
[   14.732769] firmware ath10k!cal-pci-0000:01:00.0.bin: firmware_loading_store: map pages failed  
[   14.749753] ath10k_pci 0000:01:00.0: qca988x hw2.0 target 0x4100016c chip_id 0x043202ff sub 19b6:d03c
[   14.759025] ath10k_pci 0000:01:00.0: kconfig debug 0 debugfs 1 tracing 0 dfs 1 testmode 1
[   14.768631] ath10k_pci 0000:01:00.0: firmware ver 10.2.4-1.0-00029 api 5 features no-p2p,raw-mode,mfp,allows-mesh-bcast crc32 88595bb8
[   14.813376] ath10k_pci 0000:01:00.0: board id is not exist in otp, ignore it
[   14.820484] ath10k_pci 0000:01:00.0: Direct firmware load for ath10k/QCA988X/hw2.0/board-2.bin failed with error -2
[   14.830952] ath10k_pci 0000:01:00.0: Falling back to user helper
[   14.840633] firmware ath10k!QCA988X!hw2.0!board-2.bin: firmware_loading_store: map pages failed
[   14.849571] ath10k_pci 0000:01:00.0: board_file api 1 bmi_id N/A crc32 bebc7c08
[   15.976677] ath10k_pci 0000:01:00.0: htt-ver 2.1 wmi-op 5 htt-op 2 cal otp max-sta 128 raw 0 hwcrypto 1
[   16.061071] ath: EEPROM regdomain: 0x0
[   16.061076] ath: EEPROM indicates default country code should be used
[   16.061079] ath: doing EEPROM country->regdmn map search
[   16.061083] ath: country maps to regdmn code: 0x3a
[   16.061086] ath: Country alpha2 being used: US
[   16.061088] ath: Regpair used: 0x3a

and this, with ethtool:

root@Turris-Omnia:/sys/kernel/debug/ieee80211/phy0/ath10k# ethtool -i wlan0
driver: ath10k_pci
version: 4.4.106-1e4a549d177ab3da12b2052
firmware-version: 10.2.4-1.0-00029
expansion-rom-version: 
bus-info: 0000:01:00.0
supports-statistics: yes
supports-test: no
supports-eeprom-access: no
supports-register-dump: no
supports-priv-flags: no

and this:

root@Turris-Omnia:/sys/kernel/debug/ieee80211/phy0/ath10k# iw dev wlan0 station dump
Station 80:01:84:d6:4f:fb (on wlan0)
inactive time:	680 ms
rx bytes:	3635717
rx packets:	26278
tx bytes:	19015442
tx packets:	23807
tx retries:	0
tx failed:	0
signal:  	-33 dBm
signal avg:	-38 dBm
tx bitrate:	6.0 MBit/s
rx bitrate:	6.0 MBit/s
authorized:	yes
authenticated:	yes
preamble:	long
WMM/WME:	yes
MFP:		no
TDLS peer:	no
    Station 5c:51:4f:47:9d:9d (on wlan0)
inactive time:	0 ms
rx bytes:	8741363
rx packets:	70198
tx bytes:	112956365
tx packets:	102458
tx retries:	0
tx failed:	22
signal:  	-61 dBm
signal avg:	-59 dBm
tx bitrate:	6.0 MBit/s
rx bitrate:	650.0 MBit/s VHT-MCS 7 80MHz short GI VHT-NSS 2
authorized:	yes
authenticated:	yes
preamble:	long
WMM/WME:	yes
MFP:		no
TDLS peer:	no

I hope that this info will help you

Thank you. It helps.

I see that you get other bit rates. And you have connected the card to “0000:01:00.0”. Mine is connected to “0000:02:00.0”. I can’t imagine that this is an issue but maybe I switch my cards.

For all clients in 11an / 11ac I only get a TX Rate of 54000. I do not understand why. I only know of this issue, if there are stations in the same Band, which publish lower data rates, so that the whole system will allign to these rates. But I only have 11n/11ac clients in this band.

          Peer TX rate 54000
          Peer RX rate 450000

This is really frustrating. Is really no one able or willing to help? I know that I seem to be alone with this issue but here are so many experts - is the only option to go back to my old solution and sell my Omnia?

From STA->AP I get:

iperf -c n.n.n.1 -t 30
------------------------------------------------------------
Client connecting to n.n.n.1, TCP port 5001
TCP window size:  129 KByte (default)
------------------------------------------------------------
[  4] local n.n.n.n.253 port 63247 connected with n.n.n.n.1 port 5001
[ ID] Interval       Transfer     Bandwidth
[  4]  0.0-30.0 sec   153 MBytes  42.8 Mbits/sec

From AP->STA I get:

iperf -c m.m.m.253 -t 30
------------------------------------------------------------
Client connecting to m.m.m.m.253, TCP port 5001
TCP window size: 43.8 KByte (default)
------------------------------------------------------------
[  3] local n.n.n.1 port 44310 connected with m.m.m.253 port 5001
[ ID] Interval       Transfer     Bandwidth
[  3]  0.0-30.1 sec  85.0 MBytes  23.7 Mbits/sec

at:

Station ee:ee:ee:ee:ee:ee (on wlan0)
       	inactive time: 	0 ms
       	rx bytes:      	752211713
       	rx packets:    	553678
       	tx bytes:      	165169302
       	tx packets:    	352272
       	tx retries:    	0
       	tx failed:     	1193
       	signal:        	-47 dBm
       	signal avg:    	-46 dBm
       	tx bitrate:    	6.0 MBit/s
       	rx bitrate:    	450.0 MBit/s MCS 23 40MHz short GI
       	authorized:    	yes
       	authenticated: 	yes
       	preamble:      	long
       	WMM/WME:       	no
       	MFP:   		no
       	TDLS peer:     	no

and:

Peer MAC address ee:ee:ee:ee:ee
Peer RSSI 48
Peer TX rate 54000
Peer RX rate 450000
Peer RX duration 0