TO VLAN routing speed > 50MB/s possible?

I recently install TOS 6 from HBL and configured multiple VLANs. I was hoping to put my servers on a different VLAN than my client devices, but I see that routing between VLANs maxes out at around 45-50MB/s (using iperf3 to test). Is this the best the 2-core ARM can do in the TO or is there some other bottleneck? I don’t have super complicated firewall rules, but these two VLANs are in different firewall zones and the firewall is configured to allow communication between these two zones.

iperf3 between devices in the same VLAN (but still going through the router using different switch ports) does reach the full 1GB/s.

I asked the same question: MOX wired throughput issues
TL; DR: MOX and TO allow VLAN-traffic at linespeed (didn’t test the all new 2,5 GBE yet).
Edit: my tests are intra-VLAN-traffic.
What does your CPU-utilization look like while running the test?

It turns out I’m able to route between VLANs at 1Gb/s, but only when the traffic goes into and back out of the same port (a trunk port) on the Turris Omnia.

My network looks somewhat like the following:

+----------+                      +--------------+
|          |     Trunk            |              |
|       L0 |<-------------------->|              |
|          |                      |              |
|       L1 |             +--------+              |
| TO       |             |        |      Switch  |
|       L2 |             |   +----+              |
|          |             |   |    |              |
|       L3 +---+         |   |    |              |
|          |   |         |   |  +-+              |
|       L4 +-+ |V       V|  V|  | |              |
|          | | |L       L|  L|  | |              |
+----------+ | |A       A|  A|  | +--------------+
             | |N       N|  N|  |  VLAN 10
             | |         |   |  +------------+
      VLAN 10| |1       1|  1|               |
     +-------+ |5       5|  5+-----+         |
     |         |         |         |         |
  +--+--+   +--+--+   +--+--+   +--+--+   +--+--+
  |     |   |     |   |     |   |     |   |     |
  |     |   |     |   |     |   |     |   |     |
  | PC1 |   | PC2 |   | PC3 |   | PC4 |   | PC5 |
  |     |   |     |   |     |   |     |   |     |
  +-----+   +-----+   +-----+   +-----+   +-----+

where:

  • There is a trunk port on LAN0 passing all VLANs between the TO and the switch.
  • There are 5 PCs:
    • PC1 is connected to TO LAN4 on VLAN 10
    • PC2 is connected to TO LAN3 on VLAN 15
    • PC3 is connected to switch on VLAN 15
    • PC4 is connected to switch on VLAN 15
    • PC5 is connected to switch on VLAN 10

The switch does not have any form of VLAN routing enabled. So, when PC4 and PC5 want to communicate, the traffic goes to the TO, through the firewall rules, and back out to the switch all on the trunk port.

Here is the bandwidth between the various devices:

  • PC1 <-> PC2: 50MB/s
  • PC1 <-> PC3: 50MB/s
  • PC1 <-> PC4: 50MB/s
  • PC1 <-> PC5: 100MB/s
  • PC2 <-> PC3: 100MB/s
  • PC2 <-> PC4: 100MB/s
  • PC2 <-> PC5: 50MB/s
  • PC3 <-> PC4: 100MB/s
  • PC3 <-> PC5: 100MB/s
  • PC4 <-> PC5: 100MB/s

So basically any devices which either are on the same VLAN, or which route to a different VLAN both in and back out through the trunk port, can communicate at 100MB/s. If I use one of the other physical ports on the TO to talk to a device on a different VLAN, I only get 50MB/s.

You unfortunately didn’t answer the question: are both CPUs completely utilised when running those tests which result in half line speed?

No, they are not completely utilized. One of the cores is around 70 or 80% busy (in ksoftirqd). The other core is idle. This is the same utilization I see when I get a full 100MB/s.

Even 100Mb/s looks like a small value… we are talking 1Gb/s hardware, right?

I am perhaps being a little inconsistent. I use ‘MB/s’ to mean megabytes per second not megabits, which is generally written ‘Mb/s’. So 100MB/s and 1Gb/s mean the same thing to me.

Ah OK, makes more sense…

Do you mind sharing your final configuration? /etc/config/network
EDIT: I am trying similar setup but with second Omnia instead of managed switch

Sure.

config interface 'loopback'
        option proto 'static'
        option ipaddr '127.0.0.1'
        option netmask '255.0.0.0'
        option device 'lo'

config globals 'globals'
        option ula_prefix 'fd59:e25a:ba0b::/48'

config interface 'wan'
        option proto 'dhcp'
        option device 'eth2'

config interface 'wan6'
        option proto 'dhcpv6'
        option device 'eth2'

config interface 'mgmt'
        option proto 'static'
        option netmask '255.255.255.0'
        option device 'br-lan.10'
        option ipaddr '192.168.10.1'

config interface 'trusted'
        option proto 'static'
        option netmask '255.255.255.0'
        option device 'br-lan.15'
        option ipaddr '192.168.15.1'

config device
        list ports 'lan0'
        list ports 'lan1'
        list ports 'lan2'
        list ports 'lan3'
        list ports 'lan4'
        option type 'bridge'
        option name 'br-lan'

config bridge-vlan
        option device 'br-lan'
        option vlan '10'
        list ports 'lan0:t'
        list ports 'lan4:u*'

config bridge-vlan
        option device 'br-lan'
        option vlan '15'
        list ports 'lan0:t'
        list ports 'lan3:u*'

config bridge-vlan
        option device 'br-lan'
        option vlan '20'
        list ports 'lan0:t'
        list ports 'lan2:u*'

config bridge-vlan
        option device 'br-lan'
        option vlan '25'
        list ports 'lan0:t'

config bridge-vlan
        option device 'br-lan'
        option vlan '30'
        list ports 'lan0:t'

config bridge-vlan
        option device 'br-lan'
        option vlan '35'
        list ports 'lan0:t'

config bridge-vlan
        option device 'br-lan'
        option vlan '40'
        list ports 'lan0:t'

config bridge-vlan
        option device 'br-lan'
        option vlan '45'
        list ports 'lan0:t'
        list ports 'lan1:u*'

config interface 'server'
        option device 'br-lan.20'
        option proto 'static'
        option ipaddr '192.168.20.1'
        option netmask '255.255.255.0'

config interface 'media'
        option device 'br-lan.25'
        option proto 'static'
        option ipaddr '192.168.25.1'
        option netmask '255.255.255.0'

config interface 'iiot'
        option device 'br-lan.30'
        option proto 'static'
        option ipaddr '192.168.30.1'
        option netmask '255.255.255.0'

config interface 'iot'
        option device 'br-lan.35'
        option proto 'static'
        option ipaddr '192.168.35.1'
        option netmask '255.255.255.0'

config interface 'ipcam'
        option device 'br-lan.40'
        option proto 'static'
        option ipaddr '192.168.40.1'
        option netmask '255.255.255.0'

config interface 'guest'
        option device 'br-lan.45'
        option proto 'static'
        option ipaddr '192.168.45.1'
        option netmask '255.255.255.0'
1 Like

Ok so lan0 is your trunk port then.
Thank you! I will analyze it and try to apply in my setup.

After a little more trial and error, I’m even more confused. It turns out some of the traffic speed is different depending on which direction you go (i.e. testing with ‘iperf3 -c host’ vs ‘iperf3 -c host -R’). I was also slightly wrong in my original diagram, in that PC1 ↔ PC2 is 50MB/s. It turns out its actually 100MB/s.

So here’s what I get when I break down transmission speed by direction (arrows show direction of transmission) (I’m leaving off PC4 since the characteristics are identical to PC3):
PC1 ↔ PC2: 100MB/s (in either direction)
PC1 → PC3: 50MB/s
PC1 ← PC3: 100MB/s
PC1 ↔ PC5: 100MB/s (in either direction)
PC2 ↔ PC3: 100MB/s (in either direction)
PC2 → PC5: 50MB/s
PC2 ← PC5: 100MB/s
PC3 ↔ PC5: 100MB (in either direction)

I’m very confused…

On the CPU usage of the Turris Omnia, running htop, I see the system CPU usage get up to 70 or 80 percent, but no individual processes show up with high cpu usage. Earlier when I said I saw [ksoftirqd] I mis-remembered. I do see this process showing up on htop/top when I do bandwidth tests, but it only has 3 or 4 percent CPU usage.

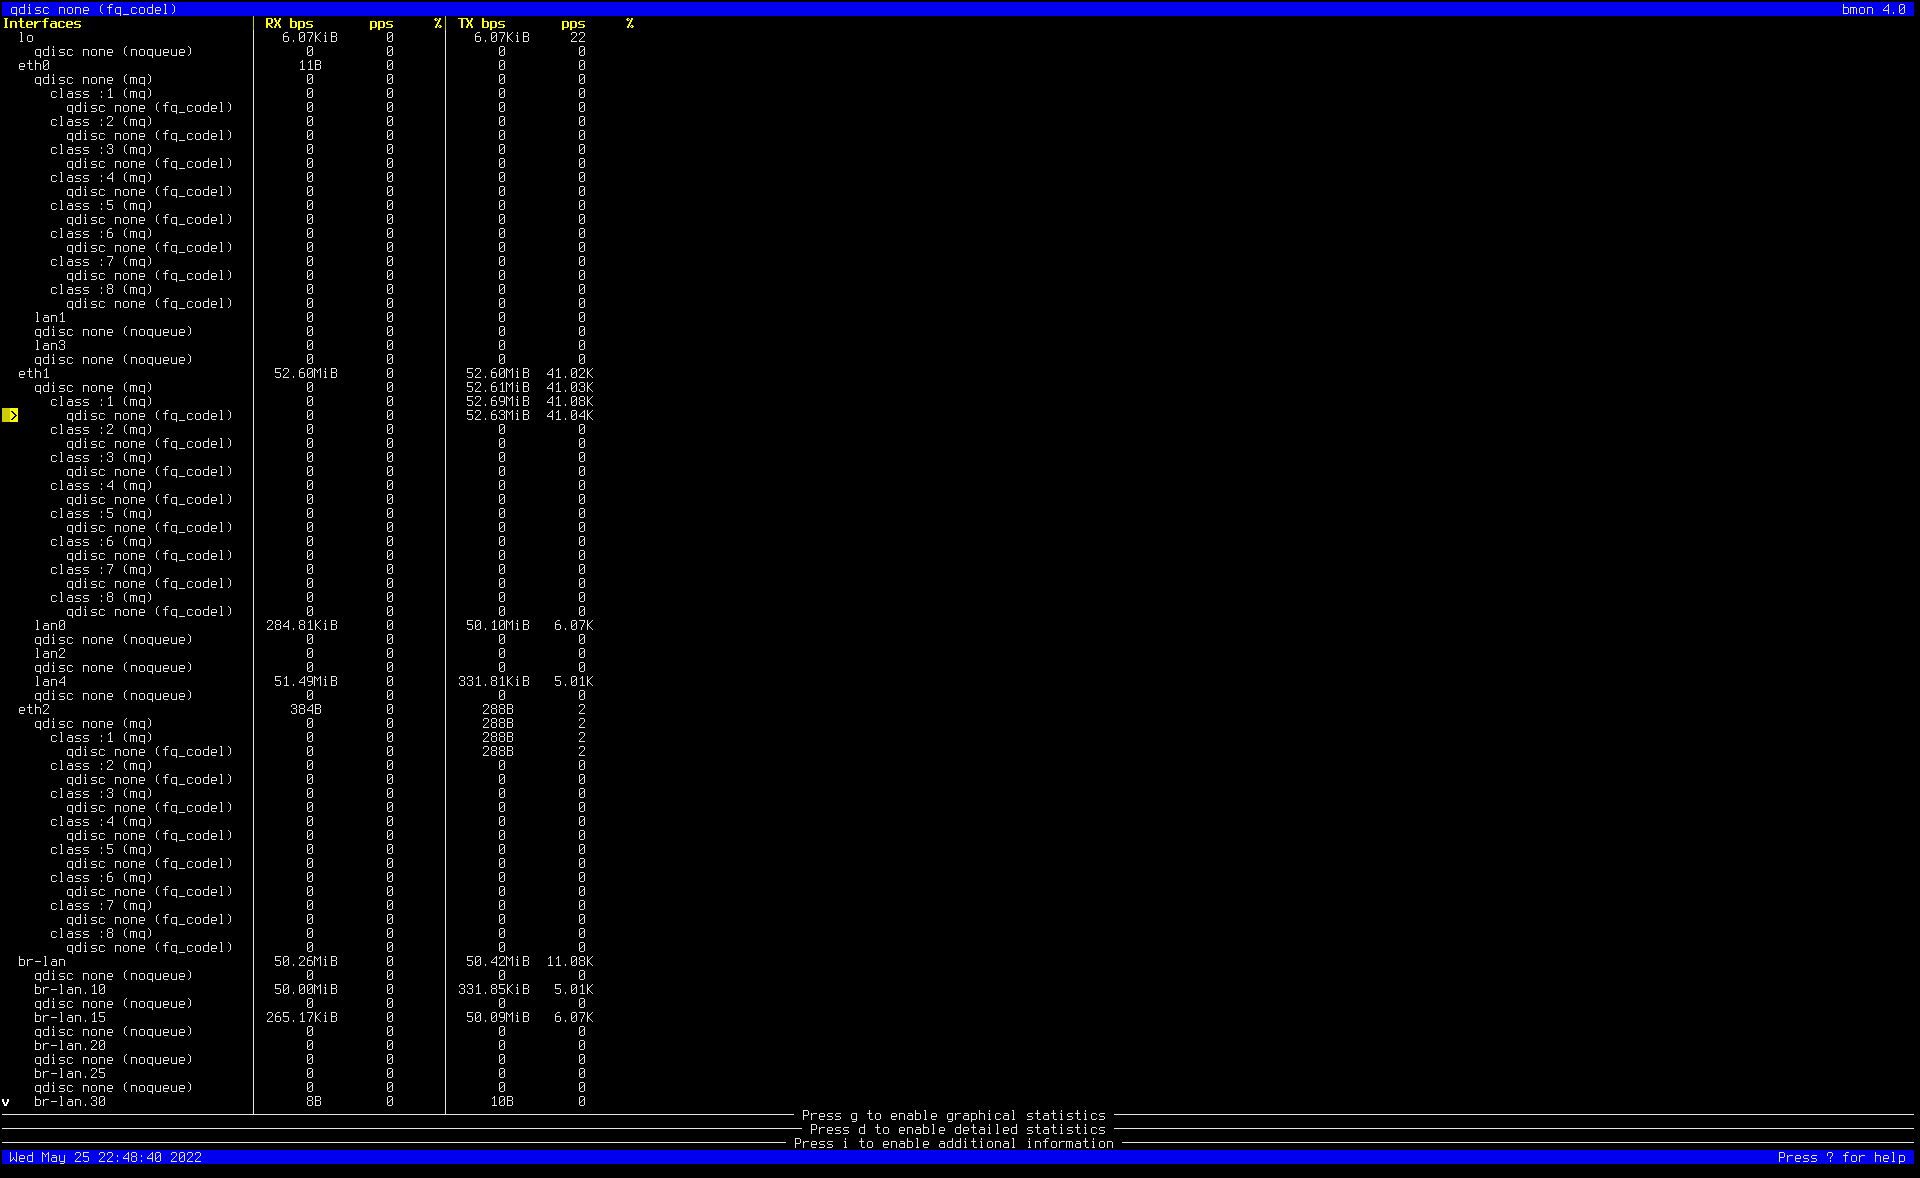
I looked at the bandwidth per interface with ‘bmon’ during these tests. It shows the same bandwidth I’m seeing in iperf3. I thought maybe it had something to do with the fact that lan0, lan2, and lan4 share eth1, and lan1 and lan3 share eth0, but both lan3 and lan4 exhibit the same behavior when communicating with lan0.

Another odd thing is that in the cases where I only have 50MB/s of bandwidth, the number of retransmissions shown by iperf3 is non-zero. It averages around 400 retransmits per second. When the bandwidth is 100MB/s, the number of retransmits is 0 or close to it.

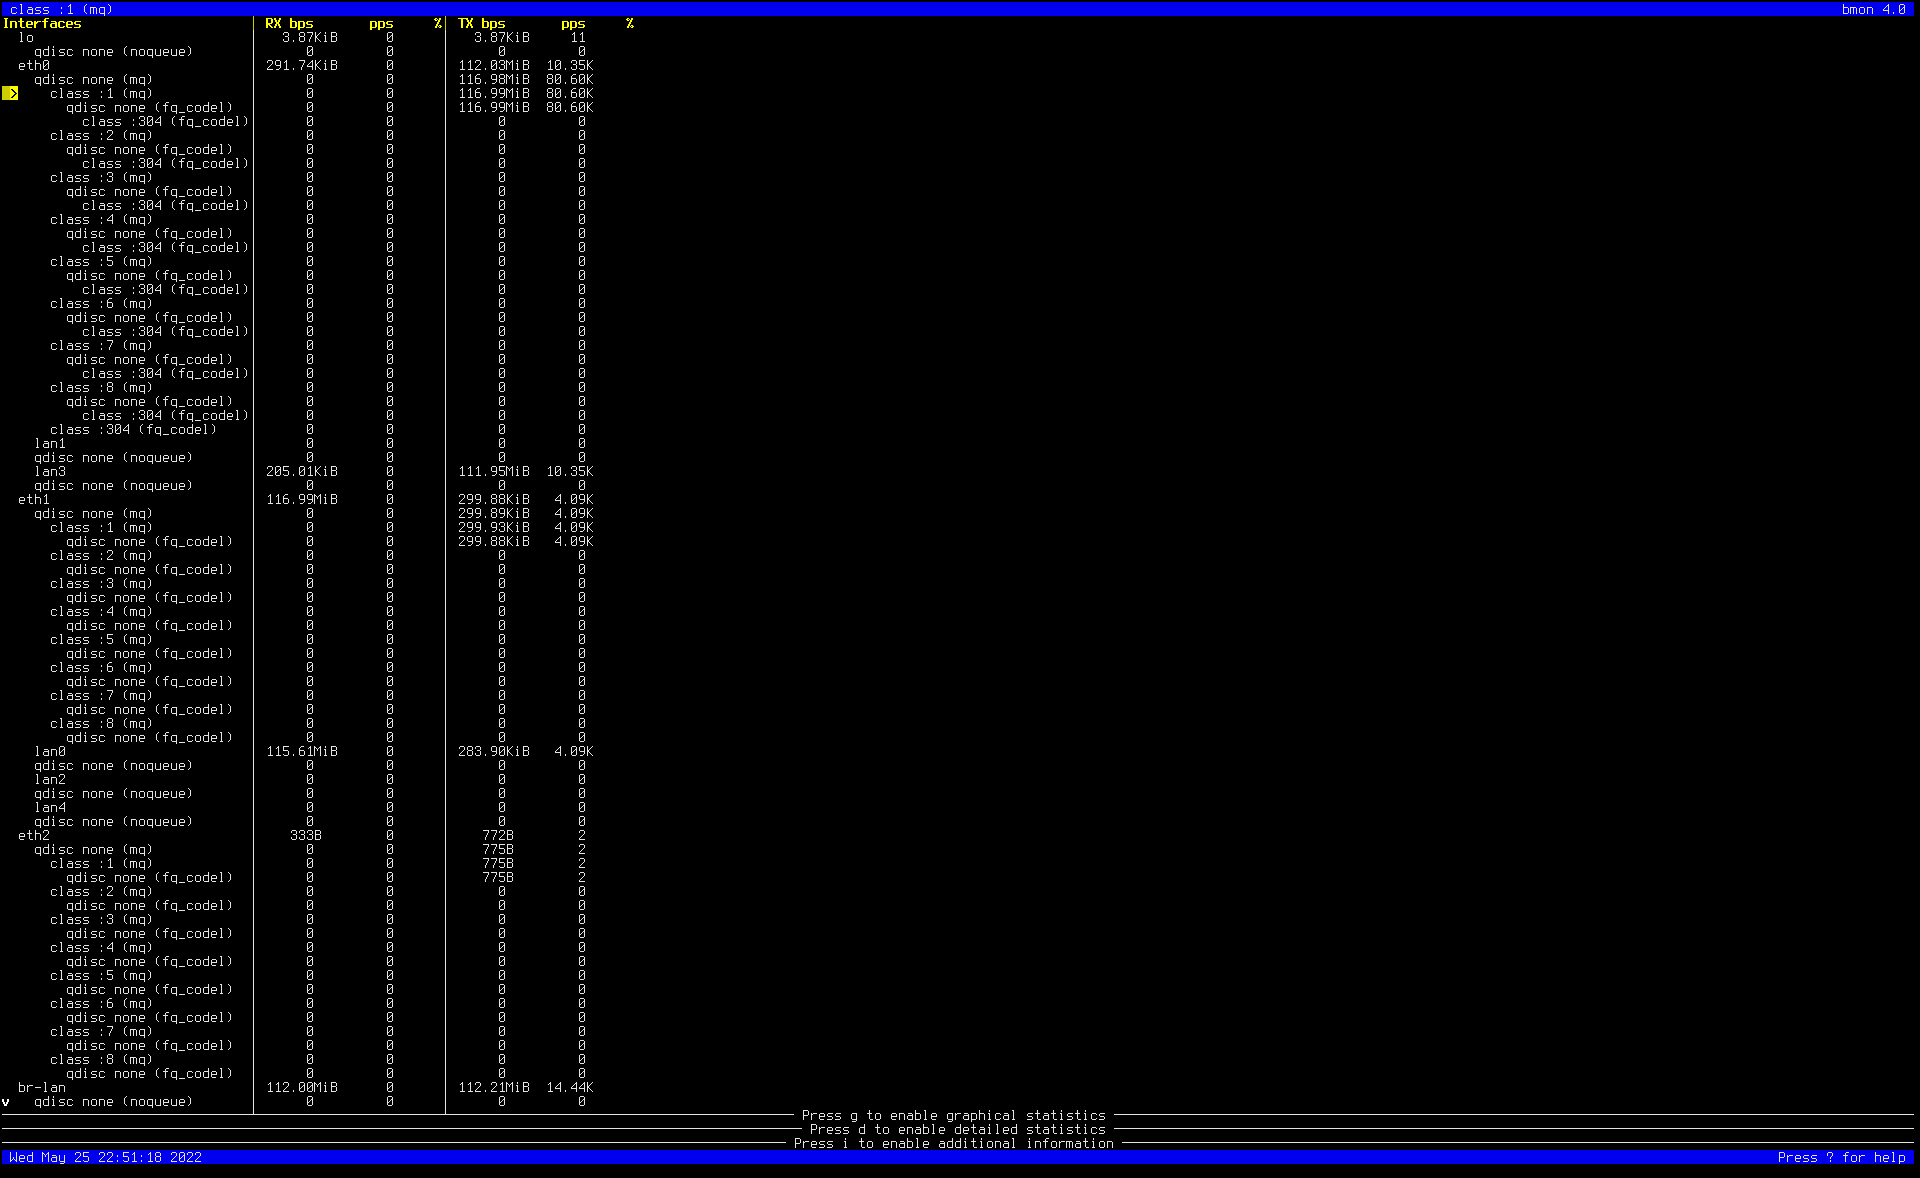
Here’s something interesting that looks suspitious. I looked at the number of packets per second shown in bmon. Looking at eth0 or eth1, when I’m getting 50MB/s, the pps (packets per second) tops out around 41k. When I’m getting 100MB/s, the individual queue inside eth0 or eth1 shows 80k or 90k, but eth0/eth1 itself only shows 14k. I wonder if packets are being fragmented in one direction but not in the other. I re-tested with ‘iperf3 --udp -b 900M’ to see if UDP instead of TCP made a difference, but the results were the same.

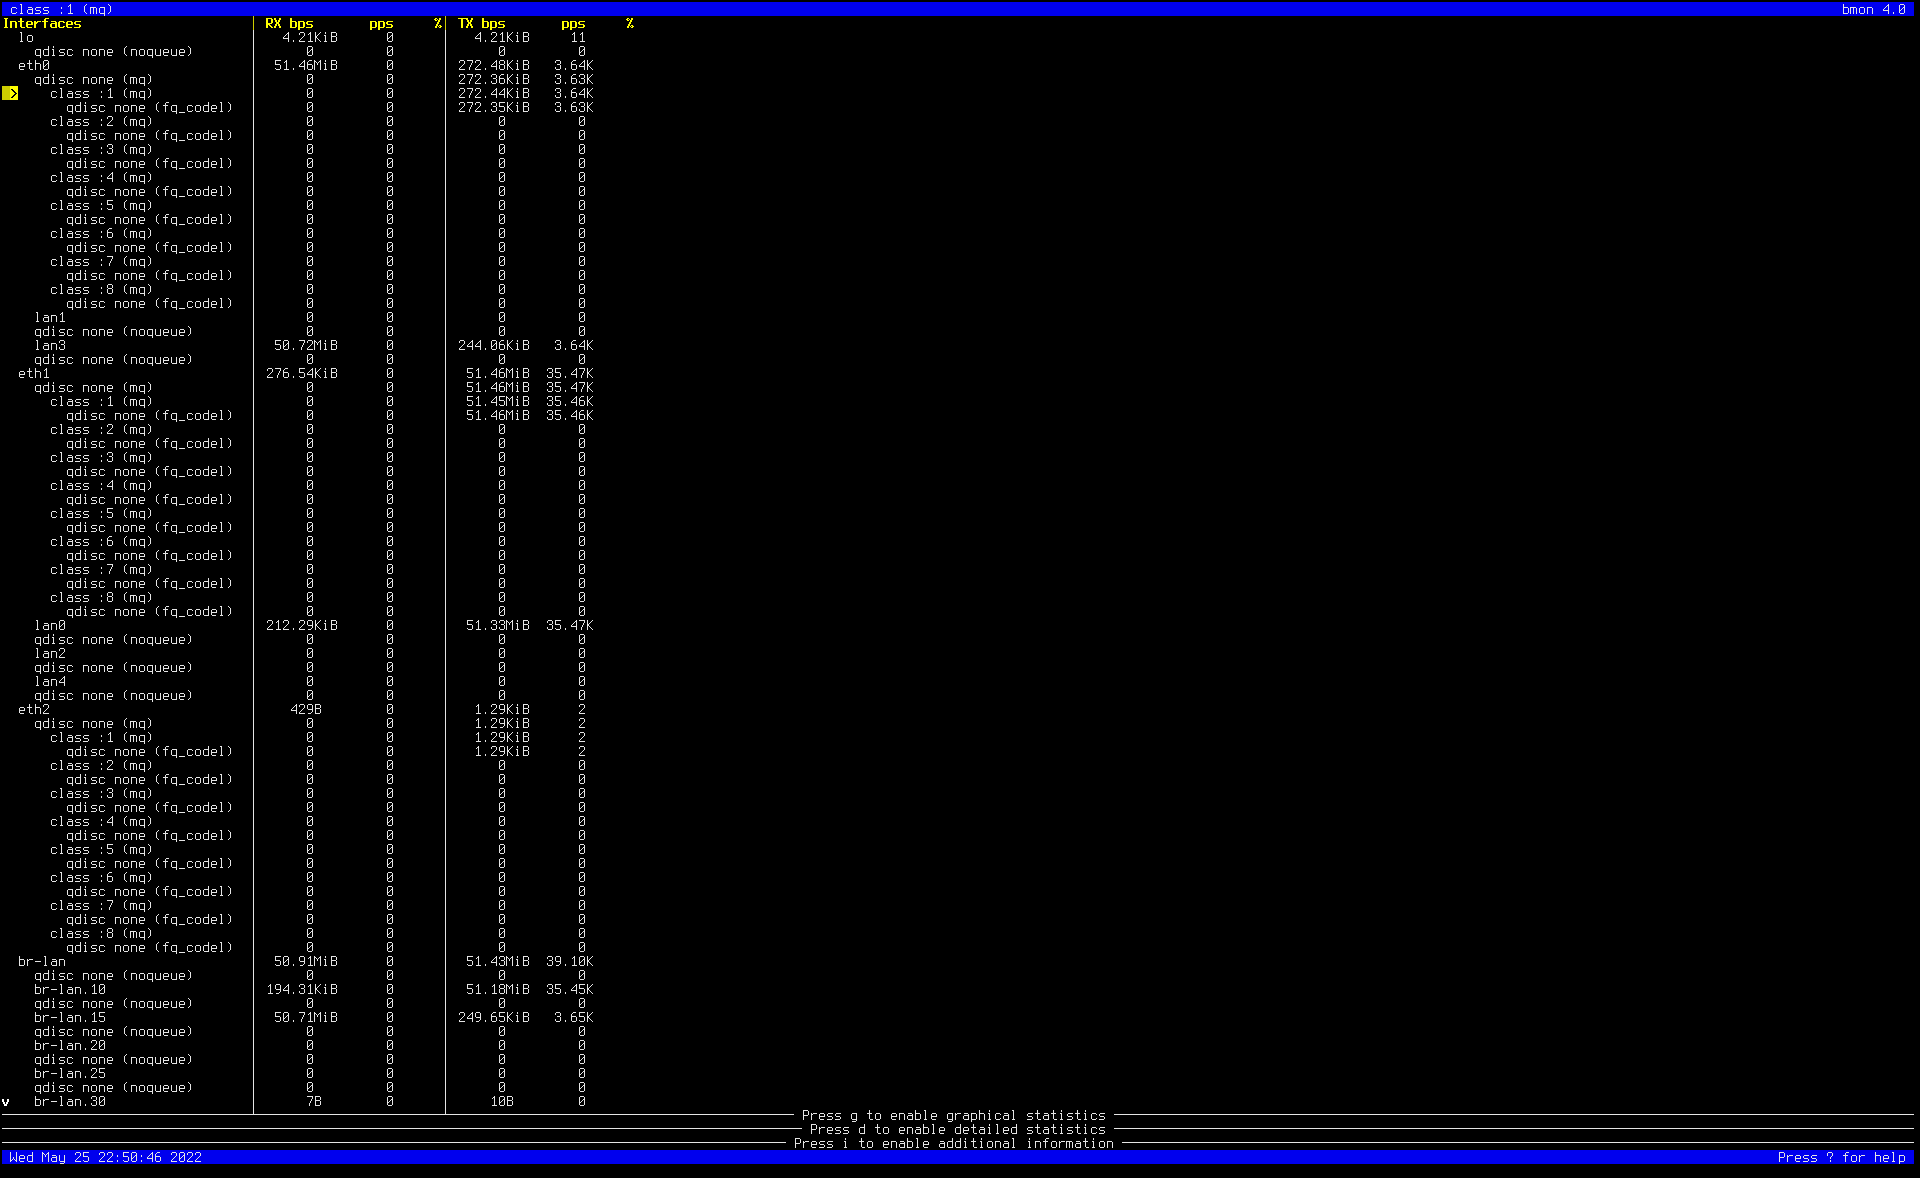
I’ve attached some screenshots of bmon in the different scenarios.

PC1 to PC3 (50MB/s)

PC3 to PC1 (100MB/s)

PC2 to PC5 (50MB/s)

PC5 to PC2 (100MB/s)

Any suggestions for what to look at next?

It looks like this issue has been resolved with the 5.15 kernel upgrade in TOS 6.0 (HBL branch).

3 Likes