another good comparison is with BBR.
modprobe tcp_bbr
Add this to the command line
–test-parameter cc_algos=bbr,bbr,bbr,bbr
another good comparison is with BBR.
modprobe tcp_bbr
Add this to the command line
–test-parameter cc_algos=bbr,bbr,bbr,bbr
I’m on 1Gbps symmetric (Fiber 7) with a Turris Omnia running Turris OS 6.0.
I configured SQM following instructions at How to use the cake queue management system on the Turris Omnia - SW tweaks - Turris forum. I’m not sure I did it right, as my performance was worse than the ~600 Mbps mentioned in the first post. I installed flent on my laptop which was connected via Gigabit Ethernet to the Turris Omnia. A browser based speed tests to a server in the same city, but outside my provider resulted in 1ms latency, Download 721.22 Mbps, Upload 817.95 Mbps.
I failed to run tests with bbr on flent 2.0.1. If you have an example command line, I’m happy to try again.
Command line (only test name was changed):
flent -x --socket-stats --step-size=.05 -H de.starlink.taht.net -H london.starlink.taht.net -H singapore.starlink.taht.net -H fremont.starlink.taht.net -t rtt_fair4be-SQM_cake_upload900000_download900000_1Gfibre_Omnia rtt_fair4be
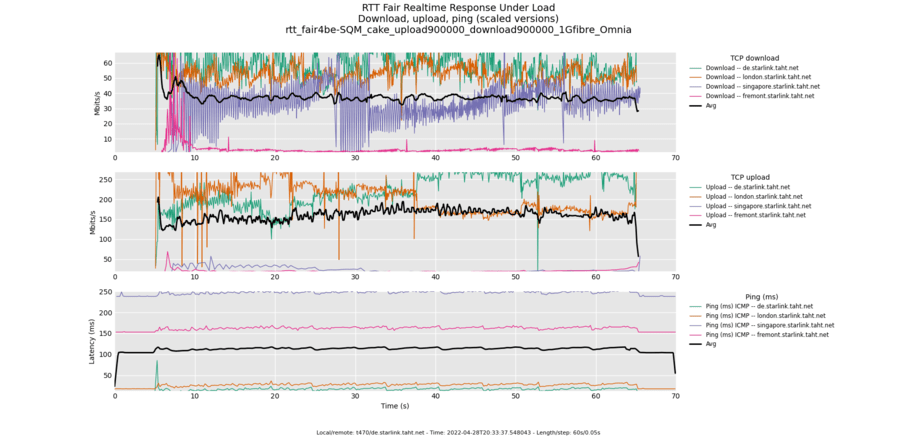
Results with SQM:
Summary of rtt_fair4be test run from 2022-04-28 18:33:37.548043
  Title: 'rtt_fair4be-SQM_cake_upload900000_download900000_1Gfibre_Omnia'

                                                         avg       median          # data pts
 Ping (ms) ICMP1 de.starlink.taht.net         :        15.71        16.60 ms             1399
 Ping (ms) ICMP2 london.starlink.taht.net     :        26.55        27.70 ms             1399
 Ping (ms) ICMP3 singapore.starlink.taht.net  :       246.76       248.00 ms             1399
 Ping (ms) ICMP4 fremont.starlink.taht.net    :       161.56       163.00 ms             1399
 Ping (ms) avg                                :       112.65          N/A ms             1399
 TCP download BE1 de.starlink.taht.net        :        58.72        57.37 Mbits/s        1399
 TCP download BE2 london.starlink.taht.net    :        52.64        52.19 Mbits/s        1399
 TCP download BE3 singapore.starlink.taht.net :        33.20        34.81 Mbits/s        1399
 TCP download BE4 fremont.starlink.taht.net   :         3.12         2.26 Mbits/s        1399
 TCP download avg                             :        36.92          N/A Mbits/s        1399
 TCP download fairness                        :         0.74          N/A Mbits/s        1399
 TCP download sum                             :       147.68          N/A Mbits/s        1399
 TCP upload BE1 de.starlink.taht.net          :       221.19       219.27 Mbits/s        1399
 TCP upload BE2 london.starlink.taht.net      :       204.03       202.76 Mbits/s        1399
 TCP upload BE3 singapore.starlink.taht.net   :        22.29        22.61 Mbits/s        1399
 TCP upload BE4 fremont.starlink.taht.net     :        19.54        19.40 Mbits/s        1399
 TCP upload avg                               :       116.76          N/A Mbits/s        1399
 TCP upload fairness                          :         0.60          N/A Mbits/s        1399
 TCP upload sum                               :       467.05          N/A Mbits/s        1399
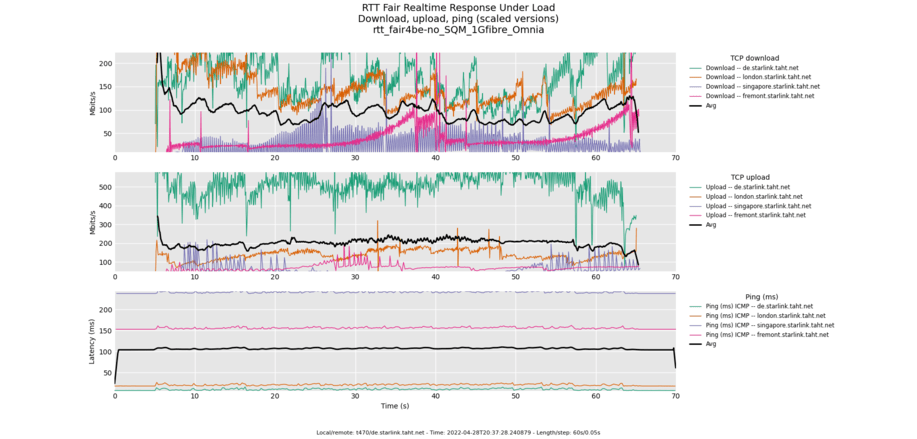
Results without SQM:
Summary of rtt_fair4be test run from 2022-04-28 18:37:28.240879
  Title: 'rtt_fair4be-no_SQM_1Gfibre_Omnia'

                                                         avg       median          # data pts
 Ping (ms) ICMP1 de.starlink.taht.net         :         9.77         9.57 ms             1400
 Ping (ms) ICMP2 london.starlink.taht.net     :        20.57        20.50 ms             1400
 Ping (ms) ICMP3 singapore.starlink.taht.net  :       240.98       241.00 ms             1400
 Ping (ms) ICMP4 fremont.starlink.taht.net    :       155.85       156.00 ms             1400
 Ping (ms) avg                                :       106.79          N/A ms             1400
 TCP download BE1 de.starlink.taht.net        :       170.24       167.42 Mbits/s        1400
 TCP download BE2 london.starlink.taht.net    :       147.30       134.62 Mbits/s        1400
 TCP download BE3 singapore.starlink.taht.net :        22.91        23.19 Mbits/s        1400
 TCP download BE4 fremont.starlink.taht.net   :        38.33        29.72 Mbits/s        1400
 TCP download avg                             :        94.70          N/A Mbits/s        1400
 TCP download fairness                        :         0.68          N/A Mbits/s        1400
 TCP download sum                             :       378.78          N/A Mbits/s        1400
 TCP upload BE1 de.starlink.taht.net          :       509.68       522.90 Mbits/s        1400
 TCP upload BE2 london.starlink.taht.net      :       137.92       142.44 Mbits/s        1400
 TCP upload BE3 singapore.starlink.taht.net   :        50.08        53.03 Mbits/s        1400
 TCP upload BE4 fremont.starlink.taht.net     :        67.82        71.19 Mbits/s        1400
 TCP upload avg                               :       191.38          N/A Mbits/s        1400
 TCP upload fairness                          :         0.51          N/A Mbits/s        1400
 TCP upload sum                               :       765.50          N/A Mbits/s        1400
I’m happy to run further tests and to share the .gz files if this would be useful, but I’d appreciate some guidance (links to read-the-detailed-instructions?) on how to run tests and how to configure things.
P.S. Thanks for the years of work on queuing and the entertaining talks. I was happy to contribute data points after seeing the Turris tests linked in article shared on LWN.net.
That isn’t very symmetric, is it? An ideal result in this case would be about 870Mbit up and 870Mbit down simultaneously. Even without SQM the total is closer to just a gbit.
In both cases you are most likely running out of CPU. Very few tests “out there” try to test both directions at the same time, and fewer vendors do - a gigbit download! ship it! You might be able to get better performance by increasing the size of the rx rings on the omnia (using ethtool), and/or trying BBR, which is less sensitive to packet loss. I’m very interested in what goes wrong on this hardware, even without SQM on but that involves various other tracing and optimization tools. irqbalance sometimes helps.
In either case the nearly ruler-flat line for latency indicates you have no bufferbloat at these speeds, with this hardware, because you are losing too many packets.
There are tests in the flent suite that test just up or just down.
Some years ago I tested SQM against a local netperf server though my omnia configured as router (NAT, firewall, but no PPPoE) after enabling packet steering for all CPUs (changing the default config to include the interrupt processing CPUs in the set of eligible CPUs) I managed to get at best 550/550 through RRUL. But again, local server with really low RTT, and nothing fancy running on the omnia (WiFi was activated but no station was connected).
I confirm there are CPU limitations on the Omnia during the flent test, even with SQM disabled. Top shows a single core at 99% (and the other mostly idle…).
Ring buffers seem to be already at the maximum:
root@turris:~# ethtool -g eth2
Ring parameters for eth2:
Pre-set maximums:
RX:		512
RX Mini:	0
RX Jumbo:	0
TX:		1024
Current hardware settings:
RX:		512
RX Mini:	0
RX Jumbo:	0
TX:		1024
Interesting that TX buffers are bigger and that TX performance is better.
I installed and started irqbalance on the omnia, but I saw no change in behaviour. All network related IRQs seem to be serviced on CPU0. (eth2 is the external interface, eth1 is connected to the ethernet switch: About - Turris Documentation)
root@turris:~# cat /proc/interrupts
           CPU0       CPU1
 17:          0          0     GIC-0  27 Edge      gt
 18:    3261296    1231854     GIC-0  29 Edge      twd
 19:          0          0      MPIC   5 Level     armada_370_xp_per_cpu_tick
 20:          0          0      MPIC   3 Level     arm-pmu
 21:     767272          0     GIC-0  34 Level     mv64xxx_i2c
 22:         30          0     GIC-0  44 Level     ttyS0
 33:          0          0     GIC-0  41 Level     f1020300.watchdog
 37:          0          0     GIC-0  96 Level     f1020300.watchdog
 38:         52          0      MPIC   8 Level     eth0
 39:   12361593          0      MPIC  10 Level     eth1
 40:    5626500          1      MPIC  12 Level     eth2
 41:          0          0     GIC-0  50 Level     ehci_hcd:usb1
 42:          0          0     GIC-0  51 Level     f1090000.crypto
 43:          0          0     GIC-0  52 Level     f1090000.crypto
 44:          0          0     GIC-0  53 Level     f10a3800.rtc
 45:          0          0     GIC-0  58 Level     ahci-mvebu[f10a8000.sata]
 46:       6526          0     GIC-0  57 Level     mmc0
 47:          0          0     GIC-0  48 Level     xhci-hcd:usb2
 48:          0          0     GIC-0  49 Level     xhci-hcd:usb4
 50:          2          0     GIC-0  54 Level     f1060800.xor
 51:          2          0     GIC-0  97 Level     f1060900.xor
 52:          7          0  f1018140.gpio  13 Level     f1072004.mdio-mii:10
 56:          0          0  mv88e6xxx-g1   3 Edge      mv88e6xxx-g1-atu-prob
 58:          0          0  mv88e6xxx-g1   5 Edge      mv88e6xxx-g1-vtu-prob
 60:          0          7  mv88e6xxx-g1   7 Edge      mv88e6xxx-g2
 62:          0          7  mv88e6xxx-g2   0 Edge      mv88e6xxx-1:00
 63:          0          0  mv88e6xxx-g2   1 Edge      mv88e6xxx-1:01
 64:          0          0  mv88e6xxx-g2   2 Edge      mv88e6xxx-1:02
 65:          0          0  mv88e6xxx-g2   3 Edge      mv88e6xxx-1:03
 66:          0          0  mv88e6xxx-g2   4 Edge      mv88e6xxx-1:04
 77:          0          0  mv88e6xxx-g2  15 Edge      mv88e6xxx-watchdog
 78:          0          0  f1018140.gpio  14 Level     8-0071
 79:          0          0    8-0071   4 Edge      sfp
 80:          0          0    8-0071   3 Edge      sfp
 81:          0          0    8-0071   0 Edge      sfp
 83:     478715          0  MPIC MSI 1048576 Edge      ath10k_pci
 84:    1416655          0     GIC-0  61 Level     ath9k
IPI0:          0          1  CPU wakeup interrupts
IPI1:          0          0  Timer broadcast interrupts
IPI2:      81390     366527  Rescheduling interrupts
IPI3:         76       1402  Function call interrupts
IPI4:          0          0  CPU stop interrupts
IPI5:          0          0  IRQ work interrupts
IPI6:          0          0  completion interrupts
Err:          0
Mh, I wonder if (and how) I can configure eth2 to use CPU1 instead? And I need to look at “enabling packet steering for all CPUs (changing the default config to include the interrupt processing CPUs in the set of eligible CPUs)” mentioned by moeller0.
To exclude path limitations: Bidirectional iperf to a speedtest server inside my ISP’s network is 893Mbps up, 912Mbps down, single direction is ~920Mbps.
I’m not sure how to configure usage of BBR with flent. man flent points me at –-test-parameter tcp_cong_control=bbr, but execution fails no matter where in the flent command line I place this. (ERROR: Found no hostnames on lookup of –-test-parameter if placed in the back, flent: error: unrecognized arguments: rtt_fair4be if placed after -x).
I think I forced bbr on the machine running flent using sysctl, but I saw no difference in performance:
# sysctl net.ipv4.tcp_allowed_congestion_control
net.ipv4.tcp_allowed_congestion_control = bbr
Oh, all tests were using IPv6 (no NAT). There are some idle devices connected to Wifi. I have the old 1GB Omnia.
I’ll look at the interrupt servicing / packet steering changes to allow multi-core usage and will report back.
For anyone else interested in more background:
I enabled packet steering and see it’s enabled after rebooted the device:
root@turris:~# grep "" /sys/class/net/eth2/queues/*/rps_cpus
/sys/class/net/eth2/queues/rx-0/rps_cpus:3
/sys/class/net/eth2/queues/rx-1/rps_cpus:3
/sys/class/net/eth2/queues/rx-2/rps_cpus:3
/sys/class/net/eth2/queues/rx-3/rps_cpus:3
/sys/class/net/eth2/queues/rx-4/rps_cpus:3
/sys/class/net/eth2/queues/rx-5/rps_cpus:3
/sys/class/net/eth2/queues/rx-6/rps_cpus:3
/sys/class/net/eth2/queues/rx-7/rps_cpus:3
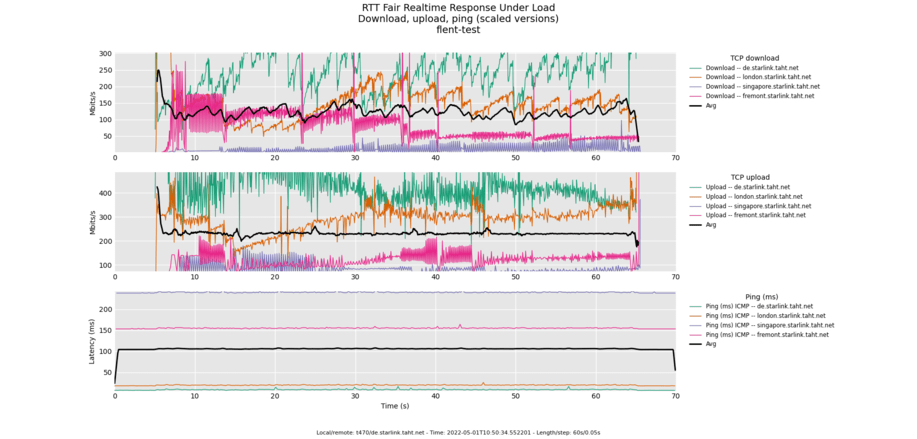
With packet steering enabled, I get 80-90% usage on CPU0 and 50-60% on CPU1 on the Omnia when running flent on a machine connected via ethernet.
Performance doesn’t look all that better, though.
Summary of rtt_fair4be test run from 2022-05-01 08:18:13.053230
  Title: 'flent-test'

                                                         avg       median          # data pts
 Ping (ms) ICMP1 de.starlink.taht.net         :         8.86         8.63 ms             1399
 Ping (ms) ICMP2 london.starlink.taht.net     :        19.67        19.50 ms             1399
 Ping (ms) ICMP3 singapore.starlink.taht.net  :       240.22       240.00 ms             1399
 Ping (ms) ICMP4 fremont.starlink.taht.net    :       154.82       155.00 ms             1399
 Ping (ms) avg                                :       105.89          N/A ms             1399
 TCP download BE1 de.starlink.taht.net        :       188.19       170.28 Mbits/s        1399
 TCP download BE2 london.starlink.taht.net    :       128.17       118.57 Mbits/s        1399
 TCP download BE3 singapore.starlink.taht.net :        15.74         8.62 Mbits/s        1399
 TCP download BE4 fremont.starlink.taht.net   :        57.33        37.57 Mbits/s        1399
 TCP download avg                             :        97.36          N/A Mbits/s        1399
 TCP download fairness                        :         0.68          N/A Mbits/s        1399
 TCP download sum                             :       389.43          N/A Mbits/s        1399
 TCP upload BE1 de.starlink.taht.net          :       459.53       460.31 Mbits/s        1399
 TCP upload BE2 london.starlink.taht.net      :       296.28       296.67 Mbits/s        1399
 TCP upload BE3 singapore.starlink.taht.net   :        69.64        79.65 Mbits/s        1399
 TCP upload BE4 fremont.starlink.taht.net     :        81.51        93.69 Mbits/s        1399
 TCP upload avg                               :       226.74          N/A Mbits/s        1399
 TCP upload fairness                          :         0.66          N/A Mbits/s        1399
 TCP upload sum                               :       906.96          N/A Mbits/s        1399
(That’s with default congestion control parameters again.)
IRQ distribution doesn’t look quite equal, but that might be OK:
root@turris:~# cat /proc/softirqs
                    CPU0       CPU1
          HI:          0          0
       TIMER:     195008     127437
      NET_TX:     300123       7943
      NET_RX:    9506939    2409559
       BLOCK:        979       1207
    IRQ_POLL:          0          0
     TASKLET:     258078         67
       SCHED:     187214     152848
     HRTIMER:          0          0
         RCU:      47275      46815
root@turris:~# cat /proc/net/softnet_stat
0095ba30 00000000 000000d3 00000000 00000000 00000000 00000000 00000000 00000000 00000002 00000000
00d42f83 00000238 00000000 00000000 00000000 00000000 00000000 00000000 00000000 0015ef49 00000000
The tenth value shows the number of times a CPU was woken up due to receive packet steering (RPS).
As a next step, I doubled rx-usec and rx-frames to reduce the number of interrupts:
root@turris:~# ethtool -c eth2
Coalesce parameters for eth2:
Adaptive RX: off  TX: off
stats-block-usecs: 0
sample-interval: 0
pkt-rate-low: 0
pkt-rate-high: 0

rx-usecs: 200
rx-frames: 64
[...]
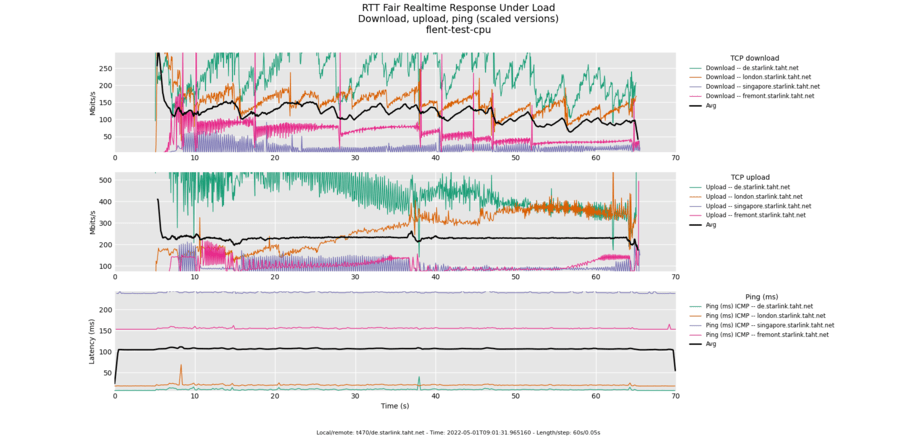
This seems to have increased download performance, although top CPU usage was similar:
Summary of rtt_fair4be test run from 2022-05-01 08:50:34.552201
  Title: 'flent-test'

                                                         avg       median          # data pts
 Ping (ms) ICMP1 de.starlink.taht.net         :         8.70         8.66 ms             1399
 Ping (ms) ICMP2 london.starlink.taht.net     :        19.46        19.50 ms             1399
 Ping (ms) ICMP3 singapore.starlink.taht.net  :       239.79       240.00 ms             1399
 Ping (ms) ICMP4 fremont.starlink.taht.net    :       154.71       155.00 ms             1399
 Ping (ms) avg                                :       105.66          N/A ms             1399
 TCP download BE1 de.starlink.taht.net        :       246.63       245.22 Mbits/s        1399
 TCP download BE2 london.starlink.taht.net    :       153.43       150.81 Mbits/s        1399
 TCP download BE3 singapore.starlink.taht.net :        10.39         7.84 Mbits/s        1399
 TCP download BE4 fremont.starlink.taht.net   :        77.37        61.75 Mbits/s        1399
 TCP download avg                             :       121.95          N/A Mbits/s        1399
 TCP download fairness                        :         0.66          N/A Mbits/s        1399
 TCP download sum                             :       487.82          N/A Mbits/s        1399
 TCP upload BE1 de.starlink.taht.net          :       426.68       416.51 Mbits/s        1399
 TCP upload BE2 london.starlink.taht.net      :       289.02       299.59 Mbits/s        1399
 TCP upload BE3 singapore.starlink.taht.net   :        75.79        78.82 Mbits/s        1399
 TCP upload BE4 fremont.starlink.taht.net     :       116.15       121.60 Mbits/s        1399
 TCP upload avg                               :       226.91          N/A Mbits/s        1399
 TCP upload fairness                          :         0.72          N/A Mbits/s        1399
 TCP upload sum                               :       907.64          N/A Mbits/s        1399
I’ll look at the impact of raising these values further. IRQ coalescing trades of latency for throughput and is not something I’d configure persistently.
400 / 128 did not increase download sum, but changed CPU usage: CPU0 showed higher usage (~90% / ~30% distribution between CPU0/CPU1 instead of the previous 80/60) and periods of both cores at 99% instead of a fairly stable distribution. There might be more optimal values, but since I’ll return to defaults after testing, I won’t spend time on finding it.
I’ve exhausted what I found in a limited search on the topic. If anyone has suggestions on what else to try, please don’t hesitate to suggest what to test.
Quick note the best achievable TCP/IPv6-throughput for unidirectional traffic over a gigabit ethernet would be (assuming MTU 1500):
1000 * ((1500-40-20)/(1500+38)) = 936.28 Mbps
in bidirectional tests, the reverse ACK traffic obviously eats into that, for TCP-Reno reverse ACK traffic is roughly 1/40 in Volume of the forward data traffic (assuming MTU 1500), so 1000/40 =25 Mbps, more modern TCPs typically emit fewer ACK packets. That means for a link running pegged to line-rate bi directionally with TCP Reno you can expect at best something around 911/911…
On yor link using both other TCPs than Reno and not saturating the link the calculation becomes a bit more challenging, but the point remains that goodput in bidirectional saturating traffic does ignore the capacity uses by ACK packets…