Performance issue with IPv6 (6rd) on Turris Omnia

Hello,

For a few weeks, IPv6 connectivity (6rd on Swisscom, 100 Mb fiber) is very slow. One symptom is that it takes minutes to load some webpages.

  1. with IPv6 deactivated, the pages load normally, within ms or s
  2. with Swiscom’s official router, IPv6 connectivity works flawlessly
  3. I saw some IPv6 performance issues where slow DNS resolution was the culprit. I think this is not the case as I saw nothing suspicious in Knot’s logs. Besides, as it should be visible in the below screenshot of Firefox’s performance monitoring, some elements taking 10’s of seconds to load are coming from the same URL/IPv6 than some other elements already successfully and timely loaded. The resolution should obviously be cached.
  4. I see many errors and frames (what is it??) in ifconfig output of the 6rd tunnel on the router

Any idea on how to resolve the problem, or to debug it further?

Many thanks.

root@turris:~# ifconfig 6rd-wan6
6rd-wan6  Link encap:IPv6-in-IPv4  
      inet6 addr: 2a02:????:????:????::1/28 Scope:Global
      inet6 addr: ::????:????/96 Scope:Compat
      UP RUNNING NOARP  MTU:1472  Metric:1
      RX packets:40010 errors:924 dropped:0 overruns:0 frame:924
      TX packets:22172 errors:0 dropped:0 overruns:0 carrier:0
      collisions:0 txqueuelen:1 
      RX bytes:48072112 (45.8 MiB)  TX bytes:2499869 (2.3 MiB)

1 Like

Hi,
I can confirm this issue. I’m using tunnelbroker.net and some sites never loads completely. Eg: openstreetmap.cz, login page on flickr.com. It loads html, some javascripts and then waits and waits and fails on timeout. I’ve checked links (console browser), result is still the same. I only noticed, that transfer speed is slowing and slowing till reaches zero.

Also sometimes, on some other pages, are requested pages loaded blank and I have to reload them. Usually helps. But not in case of openstreetmap.cz.

Switching ipv6 off helps.

My config (Turis 1.1):

root@turris ~ $ ifconfig
6in4-wan6 Link encap:IPv6-in-IPv4  
          inet6 addr: fe80::bcaf:????/64 Scope:Link
          inet6 addr: 2001:470:????:????::2/64 Scope:Global
          UP POINTOPOINT RUNNING NOARP  MTU:1480  Metric:1
          RX packets:5039482 errors:28491 dropped:0 overruns:0 frame:28491
          TX packets:3669713 errors:0 dropped:0 overruns:0 carrier:0
          collisions:0 txqueuelen:1 
          RX bytes:5807610681 (5.4 GiB)  TX bytes:524695918 (500.3 MiB)

Update: This morning all works, no issue.

Hello,
I tried accessing openstreetmap.cz and it is extremly slow to load as well when the 6rd tunnel is up. No issue at all in pure IPv4. I notice the same symptoms when looking at the browser network analysis tool. Some (small) requests are taking ages in “reception” state, and ifconfig on the router exhibits a high amount of errors on received packets.

Do you have any idea what changed in your situation, so that problematic websites are working the day after?

It might be related:

  1. Turris OS 3.10 is out now! mentions dmesg ECT flooding, that I observe too, but ONLY when the 6RD tunnel is up.
  2. a bug on OpenWRT kernel 4.9, hinting at another one on Ubuntu where a kernel 4.4, like the current Omnia, bugfix is proposed

Not being able to do it myself, could someone confirm that the current Turris Omnia Kernel includes the commit b699d0035836 (introducing a regression) but not the f4eb17e1efe5 where it was rolled back?

Thank you

1 Like

Hmm. Today it againg doesnt work. But as I noted, it worked on Sunday. Could be some issue on CDN’s.

In my case I think I was able to rule out the problem on the remote server, as I have a flawless IPv6 connectivity when I use the router provided by my ISP.

From the dmesg output on your Turris Omnia, can you spots floods like the following too?

root@turris:~# dmesg | grep non-ECT
[34052.966946] sit: non-ECT from 96.35.0.4 with TOS=0xa
[34053.079727] sit: non-ECT from 0.0.0.0 with TOS=0xa
[34053.166516] sit: non-ECT from 255.200.254.137 with TOS=0xa
[34053.192915] sit: non-ECT from 96.35.0.4 with TOS=0x9

Yes, a lot of them:

[236064.133661] sit: non-ECT from 14.198.151.0 with TOS=0x5
[236064.133788] sit: non-ECT from 14.198.151.0 with TOS=0x1
[236065.793419] sit: non-ECT from 64.12.12.12 with TOS=0x2
[236065.805260] sit: non-ECT from 64.20.8.0 with TOS=0xa
[236066.358349] sit: non-ECT from 64.12.12.12 with TOS=0x2
[236066.442113] sit: non-ECT from 64.12.12.12 with TOS=0x2
[236067.055975] sit: non-ECT from 64.20.8.1 with TOS=0xa

I noticed some improvements with 3.10.2. The “stalled” IPv6 still happened, but less than in previous release, although the sit: non-ECT flooding was still going on.
I just upgraded to 3.10.3 (4.4.138-1e8e1b4c23f383e990eb3c4f490f5f2e-1)a few minutes ago: both problems are gone. I will confirm in a few days though in order to rule out an ageing type of issue.

I’ve 3.10.3 installed, no “non-ECT” messages in dmesg, but I’m still not able to load site https://openstreetmap.cz :frowning:

To me this one looks more like a DNS latency issue, isn’t it?

1 Like

Don’t know. Problem is that this page newer fully load on ipv6.
What Can I check/change? I have Turris 1.1.

Your screenshot does not show much from the url being accessed, it would be helpful to see if this host was resolved before. It would be interesting to analyse the latency 3 lines above the one highlighted. Is it the same host?

Do you have another device with IPv6 from where you could try to see if similar issues arise?

It’t the link above screenshot. It worked before some time (don’t know exactly when stopped). Works if I switch to use IPv4 only.

Ok, what is your OS? Kubuntu?
Are you able to access properly this website from another device on your network with IPv6 enabled (another PC, smartphone)? Do you notice similar effects?

Can you post the output of

nslookup openstreetmap.cz
nslookup openstreetmap.cz 8.8.8.8
systemd-resolve --status
systemd-resolve openstreetmap.cz

Hi,
On my primary computer I’ve Gentoo, no systemd.

    worker /home/marian # nslookup openstreetmap.cz
    Server:         192.168.1.1
    Address:        192.168.1.1#53

    Non-authoritative answer:
    Name:   openstreetmap.cz
    Address: 85.255.11.55
    Name:   openstreetmap.cz
    Address: 2001:15e8:110:2337::1
    worker /home/marian # nslookup openstreetmap.cz 8.8.8.8
    Server:         8.8.8.8
    Address:        8.8.8.8#53

    Non-authoritative answer:
    Name:   openstreetmap.cz
    Address: 85.255.11.55
    Name:   openstreetmap.cz
    Address: 2001:15e8:110:2337::1

On second computer I have CentOS with the same issue. But systemd is old there - no systemd-resolve command.

Also on Android phone (Firefox) page never loads completelly. But page somehow works.
Screenshot_20180705-144532

I also checked curl. It loads almost whole page, then waits and later fails on timeout.

    [14:38:07 marian@worker ~]$ curl https://openstreetmap.cz    
    <!DOCTYPE html>
    <html lang="cs">
    <head>
        <meta charset="utf-8" />

    …

                           </div>
                            <!-- /input-group -->
                            <!-- real people should not fill this in and expect good things - do not remove this or risk form bot signups-->
                            <div style="position: absolute; left: -5000px;"><input type="text" name="b_cb9a83e4c66e393586b89e370_81b42f6aac" tabindex="-1" value="" /></div>
                        </form>
                        <p>&nbsp;</p>

                    </div>


                </div>

            </div>
    curl: (56) OpenSSL SSL_read: SSL_ERROR_SYSCALL, errno 110

I’ve tested this on remote server with ipv6 and it works correctly. Entire page is downloaded within several seconds.

I’m not sure that this is DNS issue. Looks like packets were blocked somewhere.

My tunnel settings:

Maybe I could try lower MTU.

UPDATE: tested MTU 1280 - no change

I’ve one more page that doesn’t work: http://www.msmt.cz/ (Czech ministry of education).

And I still don’t know, how identify where the problem is. On Turris or on HE? Or simple combination of both?

And simillar issue with http://www.lightningmaps.org
It looks to mee that it happen only when page exceed some size limit.

Name resolution yields the exact same results for me, and I have no issue loading these website. The routes are obviously different though. It could be worth checking if the traceroute6 highlights something eerie. For the record, here is mine.

samuel@bioman2:~/dev/certificate/LE$ traceroute6 openstreetmap.cz
traceroute to  (2001:15e8:110:2337::1) from 2a02:1205::dead:beef, 30 hops max, 24 byte packets
 1  dynamic.wline.6rd.res.cust.swisscom.ch (2a02:1205:dead:beaf::1)  0.496 ms  0.391 ms  0.508 ms
 2  ae60-60.ipc-zhb790-m-pe-48.bluewin.ch (2001:4d98:bffd:1d::2)  4.808 ms  33.002 ms  9.704 ms
 3  ae60-60.ipc-zhb790-m-pe-48.bluewin.ch (2001:4d98:bffd:1d::2)  7.616 ms  4.692 ms  4.783 ms
 4  2001:4d98:bffd:1f::3 (2001:4d98:bffd:1f::3)  8.511 ms  8.711 ms  8.328 ms
 5  inx-015-lo0-0.ip6.ip-plus.net (2001:918:100:d::1)  8.195 ms  8.277 ms  8.097 ms
 6  10gigabitethernet1-4.core1.zrh1.he.net (2001:7f8:24::aa)  8.232 ms  8.035 ms  8.154 ms
 7  10ge10-7.core1.fra1.he.net (2001:470:0:21c::1)  23.122 ms  16.68 ms  24.499 ms
 8  100ge14-1.core1.prg1.he.net (2001:470:0:213::2)  21.932 ms  21.948 ms  21.94 ms
 9  nix2-ipv6.forpsi.net (2001:7f8:14::53:2)  23.029 ms  23.129 ms  23.472 ms
10  2001:15e8:0:3::2 (2001:15e8:0:3::2)  61.08 ms  26.586 ms  26.168 ms
11  osm.kasparkovi.net (2001:15e8:110:2337::1)  26.021 ms !X  26.289 ms !X  25.992 ms !X

I see from the screenshot and the description that you are in 6in4 to HE, whereas my setup is with 6rd. No idea if this difference is important or not!

A last idea: are you able open the tunnel directly from one of your linux machine and see if the problem occurs?

Quite complicated, but I did it a little differently. I tried the same curl command on my laptop and then directly from turris. It works properly there, so issue is between router and laptop. Probably not wifi issue, as my CentOS computer is connected via cable and currently I’m connected via OpenVPN.

Directly from Turris

 marian@turris ~ $ time curl -6 https://openstreetmap.cz >/dev/null
  % Total    % Received % Xferd  Average Speed   Time    Time     Time  Current
                                 Dload  Upload   Total   Spent    Left  Speed
100 32959    0 32959    0     0  51903      0 --:--:-- --:--:-- --:--:-- 56052
real    0m 0.66s
user    0m 0.03s
sys     0m 0.00s

turris ~ # traceroute6 openstreetmap.cz
traceroute to openstreetmap.cz (2001:15e8:110:2337::1) from 2001:470:6f:7b6::1, 30 hops max, 16 byte packets
 1  tunnel306502.tunnel.tserv27.prg1.ipv6.he.net (2001:470:6e:7b6::1)  12.814 ms  12.165 ms  12.165 ms
 2  10ge2-1.core1.prg1.he.net (2001:470:0:221::1)  8.175 ms  8.052 ms  7.894 ms
 3  nix1-ipv6.forpsi.net (2001:7f8:14::53:1)  17.636 ms  15.366 ms  14.757 ms
 4  2001:15e8:0:1::1 (2001:15e8:0:1::1)  17.401 ms  12.062 ms  13.125 ms
 5  osm.kasparkovi.net (2001:15e8:110:2337::1)  13.573 ms !S  82.478 ms !S  11.5 ms !S

From laptop (currently connected via VPN)

[22:01:01 marian@nbmkyral ~]$ time curl -6 https://openstreetmap.cz >/dev/null
  % Total    % Received % Xferd  Average Speed   Time    Time     Time  Current
                                 Dload  Upload   Total   Spent    Left  Speed
100 32982    0 32982    0     0     44      0 --:--:--  0:12:19 --:--:--     0
curl: (56) OpenSSL SSL_read: SSL_ERROR_SYSCALL, errno 110

real    12m19,279s
user    0m0,085s
sys     0m0,020s

[22:45:30 root@nbmkyral ~]# traceroute6 openstreetmap.cz
traceroute to openstreetmap.cz (2001:15e8:110:2337::1), 30 hops max, 80 byte packets
 1  2001:470:6f:7b6::1 (2001:470:6f:7b6::1)  14.015 ms  66.435 ms  66.440 ms
 2  tunnel306502.tunnel.tserv27.prg1.ipv6.he.net (2001:470:6e:7b6::1)  66.438 ms  66.435 ms *
 3  * * *
 4  * * *
 5  2001:15e8:0:3::2 (2001:15e8:0:3::2)  66.373 ms 2001:15e8:0:1::1 (2001:15e8:0:1::1)  66.375 ms 2001:15e8:0:3::2 (2001:15e8:0:3::2)  66.362 ms
 6  osm.kasparkovi.net (2001:15e8:110:2337::1)  66.343 ms !X  23.275 ms !X  23.457 ms !X
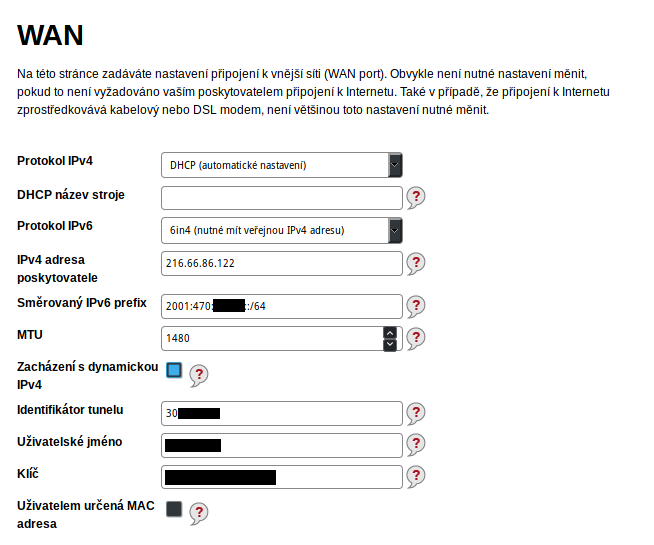
Configuration

tap0: flags=4163<UP,BROADCAST,RUNNING,MULTICAST>  mtu 1500
        inet 192.168.1.221  netmask 255.255.255.0  broadcast 192.168.1.255
        inet6 fd39:c274:6a4a:0:c4e2:XXXXX  prefixlen 64  scopeid 0x0<global>
        inet6 2001:470:6f:7b6:c4e2:XXXXX  prefixlen 64  scopeid 0x0<global>
        inet6 fe80::c4e2:XXXXX  prefixlen 64  scopeid 0x20<link>
        ether c6:e2:00:12:c0:65  txqueuelen 100  (Ethernet)
        RX packets 1029763  bytes 1340567939 (1.2 GiB)
        RX errors 0  dropped 2  overruns 0  frame 0
        TX packets 641337  bytes 61676599 (58.8 MiB)
        TX errors 0  dropped 315 overruns 0  carrier 0  collisions 0

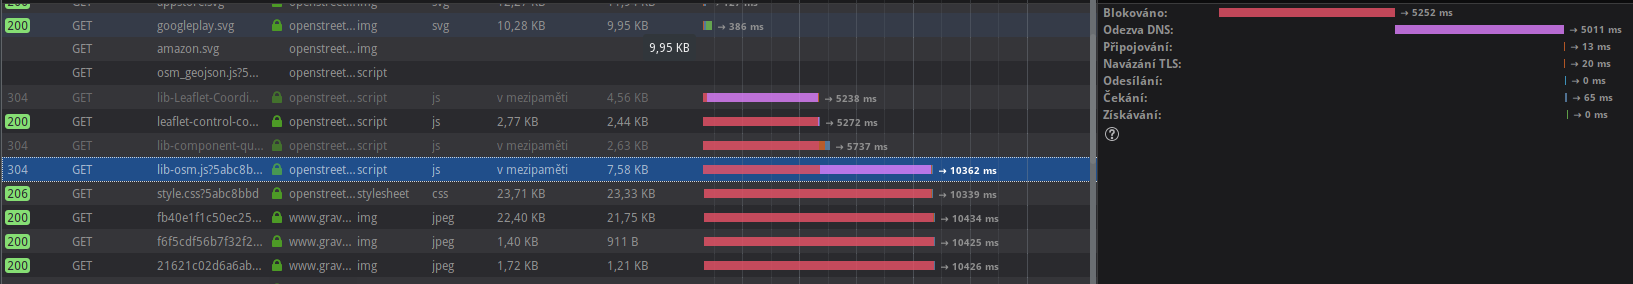
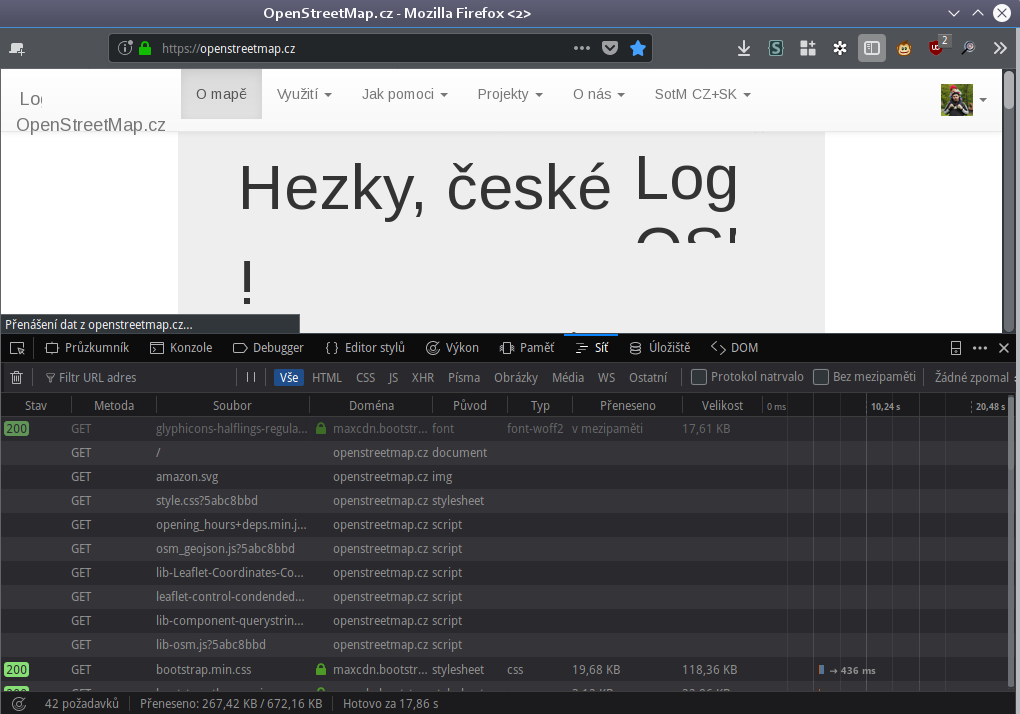
Any idea, what to check now?

UPDATE: just tested debian in LXC - the same issue…

marian@homeassistant:~$ time curl -6 https://openstreetmap.cz >/dev/null
  % Total    % Received % Xferd  Average Speed   Time    Time     Time  Current
                                 Dload  Upload   Total   Spent    Left  Speed
100 25322    0 25322    0     0    101      0 --:--:--  0:04:08 --:--:--     0^C

real    4m9,380s
user    0m0,176s
sys     0m0,037s
marian@homeassistant:~$ time curl -4 https://openstreetmap.cz >/dev/null
  % Total    % Received % Xferd  Average Speed   Time    Time     Time  Current
                                 Dload  Upload   Total   Spent    Left  Speed
100 32956    0 32956    0     0    99k      0 --:--:-- --:--:-- --:--:--   99k

real    0m0,415s
user    0m0,115s
sys     0m0,022s

Seeing that your connection works well from the Turris command line but not from an LXC instance makes me think that the issue might be at the interface or firewall level.

The curl command from the Turris command line directly uses the wan/wan6 interface, whereas the LXC and all your other machines are sending packets to the lan interface, which then forwards them to wan/wan6 interface.

Do you have customised filtering or logging rules? Is pakon or any other logging service running?