Downtime: Firewall: 22 hours - uCollect: 22 hours

During the previous day, following downtime of your router “Router 1” was recorded:

Firewall: 22 hours
uCollect: 22 hours

The total sum of outages is currently 0 h.

I dont understand this - was the firewall down in 22 hours or 22 hours ago? - When the sum of outages currently is 0 hour?

This was supposed to track downtime of previous Turris. Because it was in contract that it shouldnt be down for a long time. That’s why you have sum of outages 0 hour. Don’t worry about it.

You should worry about Firewall and sending data (uCollect) to CZ.NIC, why they were down.
It means they were offline for 22 hours.

It’s probably that you installed it and have it running only 2 hours yesterday. Next day (today) it should be normal.

Since the last update, the down time has been increasing, up to 61 hours now… Should I be worry?

This is what I got in the email:

During the previous day, following downtime of your router “Arcadia” was recorded:

Firewall: 24 hours
uCollect: 24 hours

The total sum of outages is currently 61 h.

Plus, I don’t know what to do about it…
Thanks

It’s weird, because I don’t get this notification for both Turris, what I own.

You have to enable the downtime notifications under Settings.

Thanks @milos but I already receive downtime notifications by email, this is why I’m worried, it keeps going on:

During the previous day, following downtime of your router “Arcadia” was recorded:

Firewall: 24 hours
uCollect: 24 hours

The total sum of outages is currently 109 h.

I tried restarting both services but nothing changed.
I tried contacting TO team (tech.support@turris.cz) but no luck at this point.

I have the same problem, now for 3 days in total. Nothing was changed manually.

HI, @donhylo, I replied actually to @Pepe, who complains about not getting the notifications.

You have probably to wait for the Turris Team to respond. Maybe @Vaclav can speed it up a little bit? :wink:

My bad I should say it more clear.y
I meant that my uptime is OK for both Turris. :wink:
So there wasnt any reason to get email notifications about it.

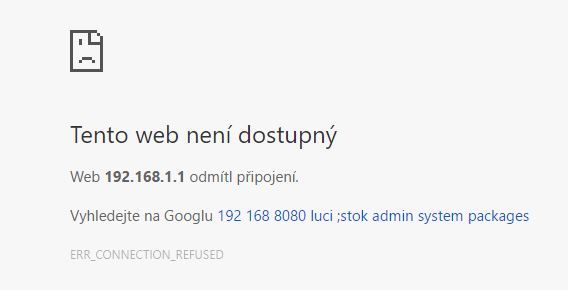
Yesterday I made reboot. Then I was not able to login to Turris (192.168.1.1). After some rebooting computer/Turris I was able to use internet w/o login to T. After another reboot I was able to login to Turris, but not to use internet (some DNS problem). In the morning I switch off in Luci the first option under DNS sheet. After that it started to working normally again. But not sure about sending the datas.

The problem is still the same, Firewall not sent from 8.12., now 130h.

Unfortunately I have the same problem. Since update, FW and uCollect logs are not collecting. Also I am not able to access web gui and wifi network is not visible.
I tried everything, also several times factory reset, restarts, manually run updater.sh, updater.sh -n, but nothing helped.
In every attempt, i did factory reset, basic configuration - everything worked. Then I saw in gui, that restart is needed. I has been waiting couple of hours, then restarted it and router was in the same non working state (no gui, no wifi).

The only “solution” to have gui accessible was to run opkg upgrade, but then it breaks whole router - factory reset.

Could you please advice what to do to fix it?

I have Turris 1.0

Did you try restarting Lighthtpd, as commented in the following posts?

Coming back to the initial issue of this threat about data not being sent to Turris server.

After the new update, I noticed in Foris > Data Collection that data collection has not been preserved after the update. So I reenter my email address. Then I also noticed in Foris > About that you can check if data are being sent or not.

After doing that uCollect was sending data but the Firewall was working erratically (actually now it says ‘broken’).

From this post I can see how to try to fix a uCollect problem but not a Nikola problem (i.e. firewall data not being sent)… any guess?

1 Like

@mejlacz @donhylo @Pepe @romcan
So is there anyway to fix this?

I tried to disable/re-enable data collection plus a reboot but to no avail. The service has been offline for a few days now.

Hello,
Yes. You disabled cron. Enable it. :slight_smile:

@Pepe Ok. You were right. cron was disabled. I just reanabled it and started it and the sending is still offline. Should there be a scheduled cron job in the cron file? I don’t see any.

There are 3 options:
a) run manually: "/usr/share/nikola/bin/nikola.sh"
b) restart router
c) wait

Thanks for the quick support. This helped, b) and c) didn’t work. Log sending is now online again.

b) Should work.
c) Process nikola is started every 15 minutes according to cron.