I have 17 instances of this process running:
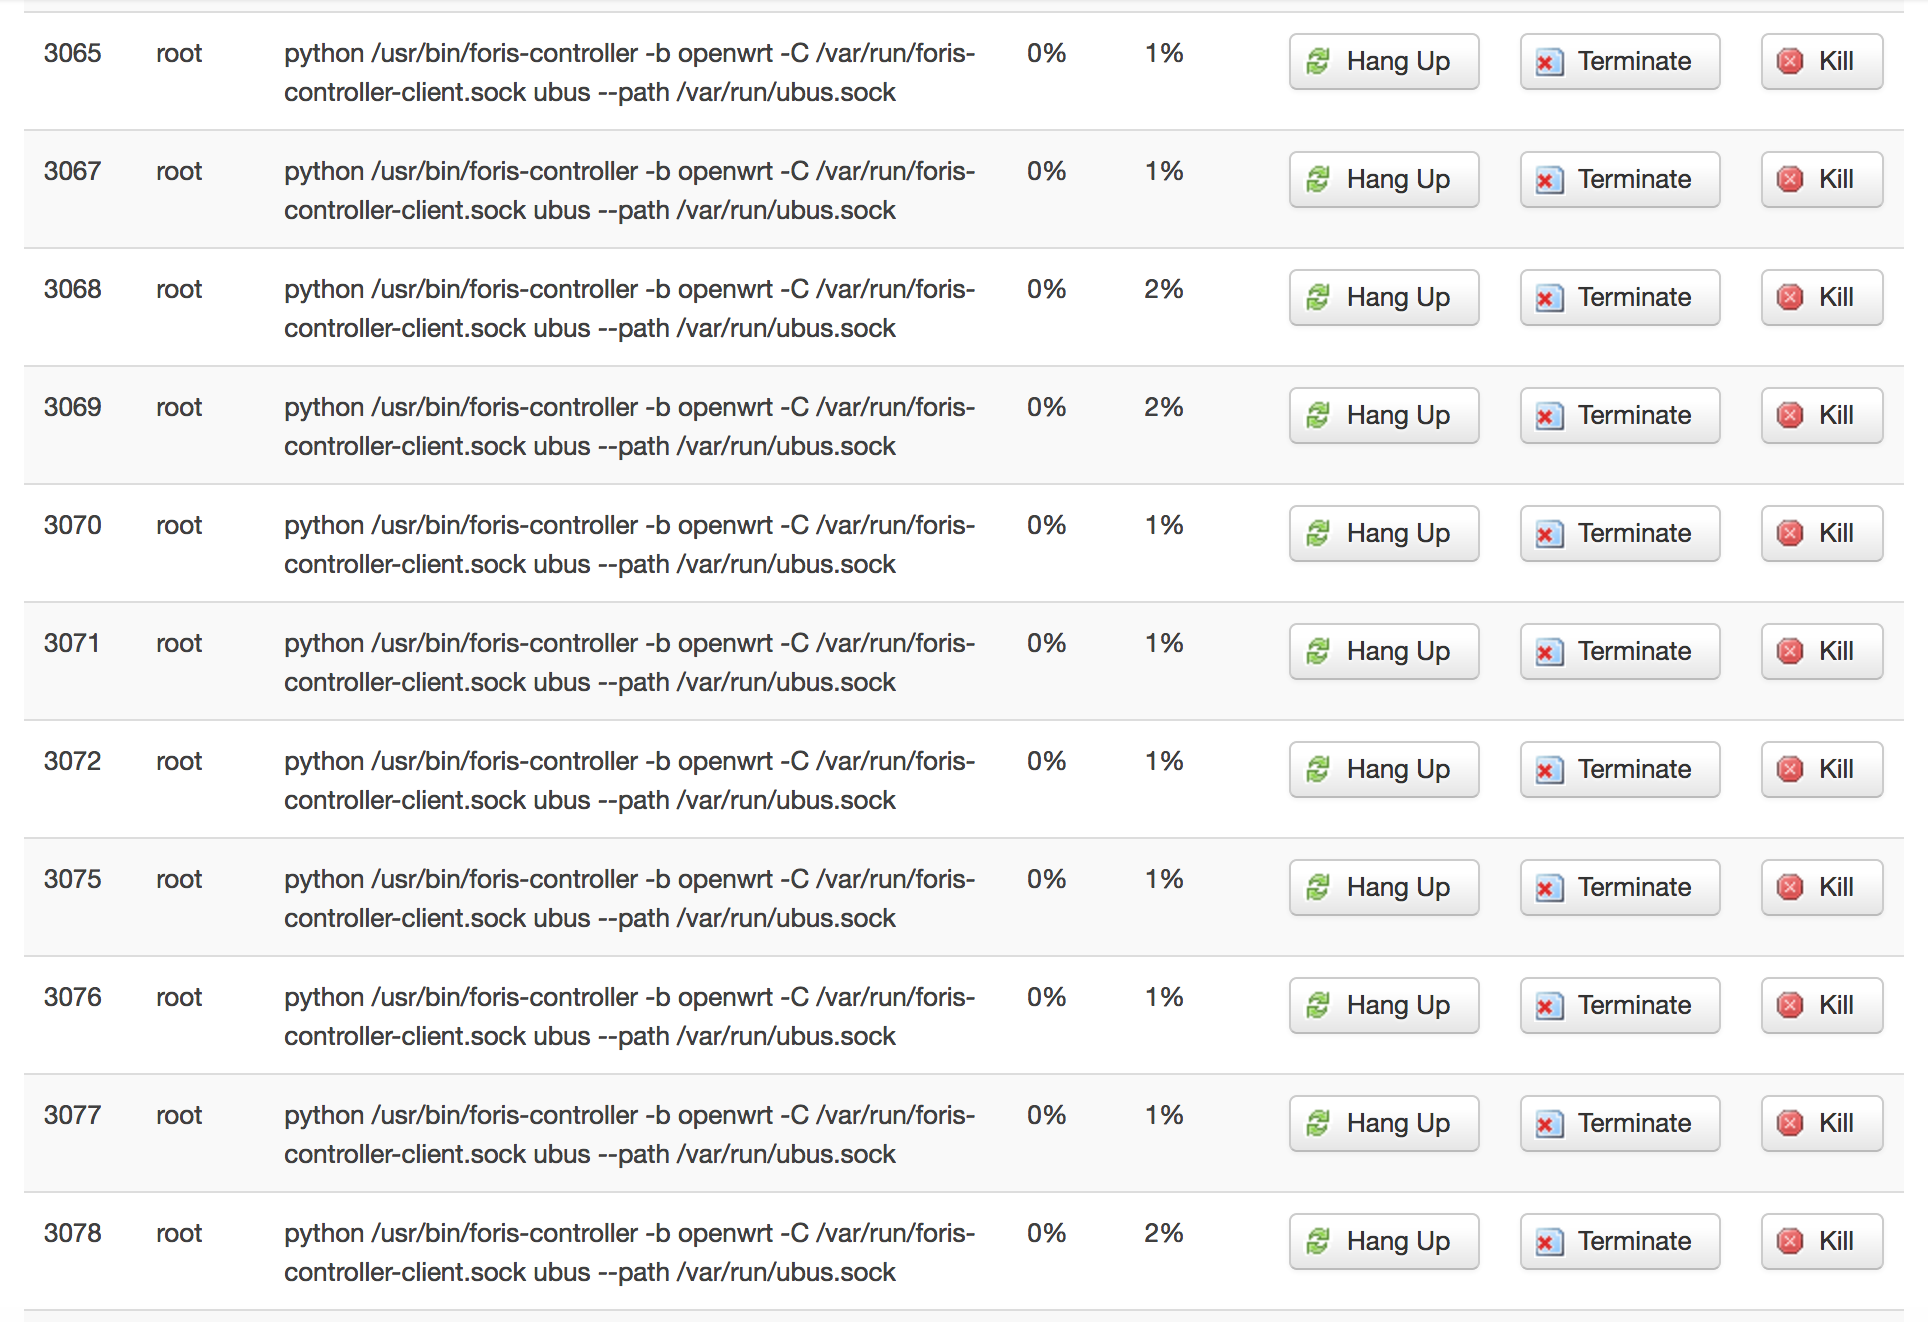
Is this normal?
Could this be related to why I only have 11% of memory available?
I have 17 instances of this process running:
Is this normal?
Could this be related to why I only have 11% of memory available?
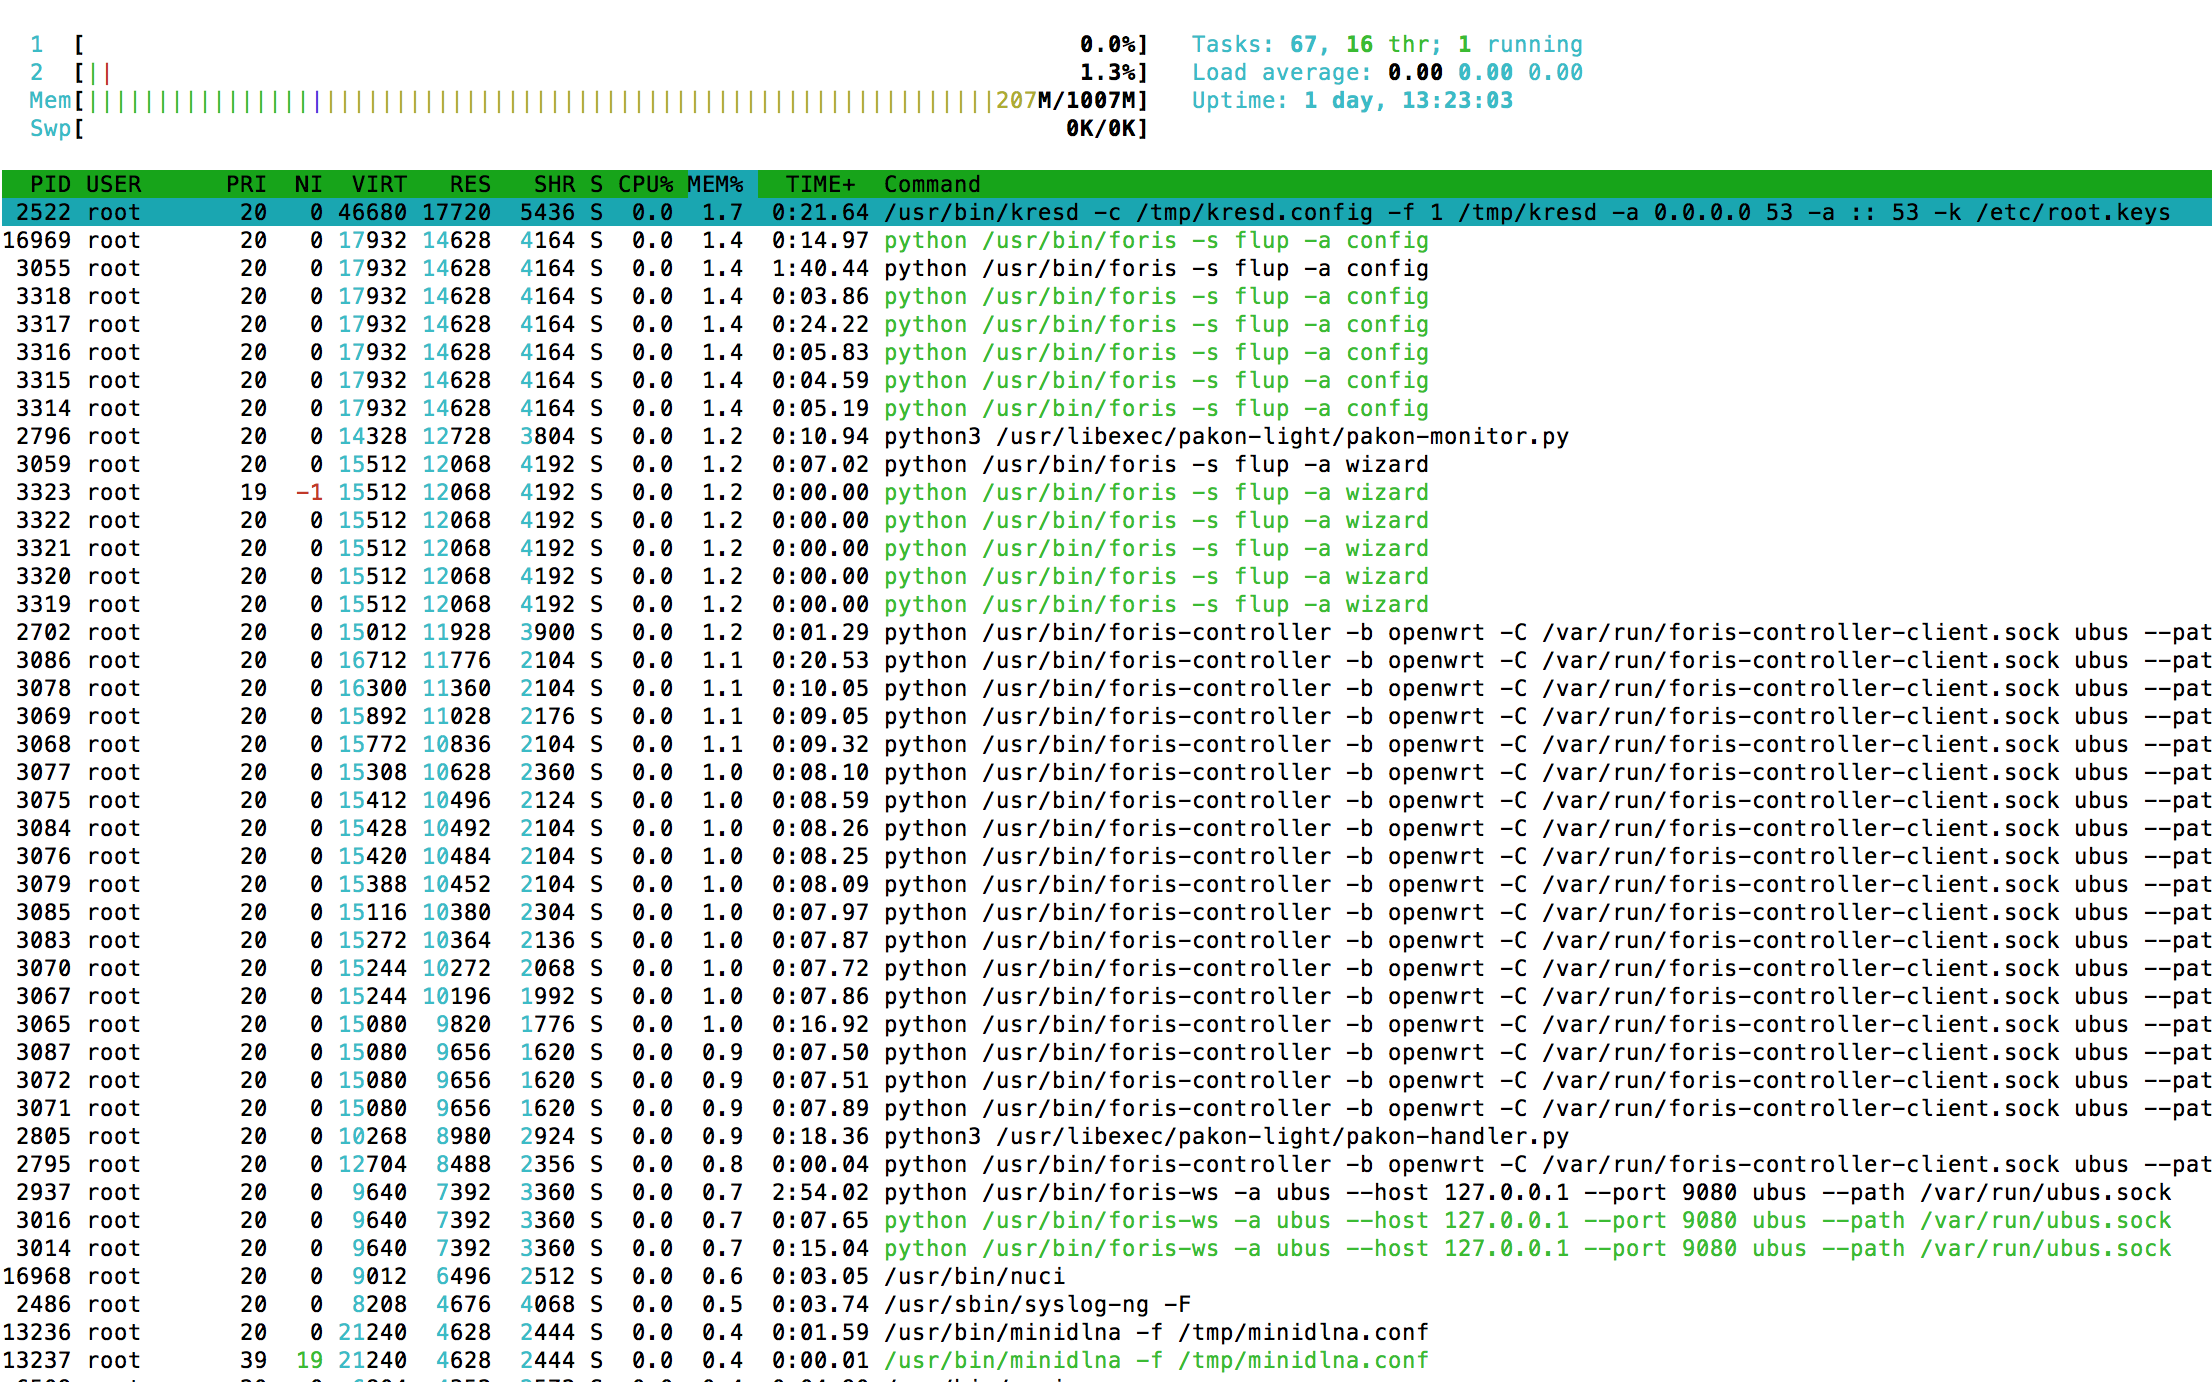
The memory graph in luci is pretty useless, because it doesn’t count disk cache into the free/available memory. To get more information, you can use e.g. the free command, though unfortunately the busybox version is missing the most useful “available” column.
root@turris:~# free -h
             total       used       free     shared    buffers     cached
Mem:       1030944     982460      48484      37704       1040     658032
-/+ buffers/cache:     323388     707556
Swap:            0          0          0
htop (needs to be installed manually) is a pretty good cli tool, or the simple version top
the busybox package in TO is rather outdated and missing vital features.
root@turris:~# free
             total       used       free     shared    buffers     cached
Mem:       1030944     909652     121292       6388       4804     673100
-/+ buffers/cache:     231748     799196
Swap:            0          0          0
Does this look reasonable?
That is actual 207 M out of 1007 M, roughly 20%, and nothing unusual (IMHO).
OK, but why are there so many foris-controller-client instances?
My guess is that the shown “processes” are really threads of the same process (that’s what the color difference in htop means IIRC), so all the memory is shared by the bunch. Even so, it seems relatively lots of threads, but I don’t know the Foris implementation…
Use F5 in htop to show the thread tree. I see a similar large number (17) of those threads in question and start wondering too about the number of those instances
The process has around 16 threads for my Omnia and Turris 1.x as well, so I expect it’s probably “normal” (i.e. the same for every Turris).
OK. Glad to know that others are sharing my experience.