ogghi
April 13, 2020, 8:14am
1
Hi there,
I am trying to get graphs working to see network usage etc.
Installed plugins:
collectd
4.10.8-4
collectd-mod-cpu
4.10.8-4
collectd-mod-df
4.10.8-4
collectd-mod-disk
4.10.8-4
collectd-mod-interface
4.10.8-4
collectd-mod-iwinfo
4.10.8-4
collectd-mod-load
4.10.8-4
collectd-mod-memory
4.10.8-4
collectd-mod-network
4.10.8-4
collectd-mod-rrdtool
4.10.8-4
collectd-mod-wireless
4.10.8-4
librrd1
1.0.50-2
rrdtool1
1.0.50-2
Still:
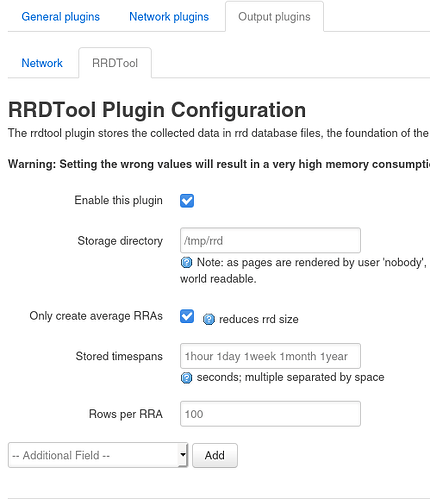
Under setup:
Also the plugins are enabled.
Skippi
April 13, 2020, 11:13am
2
Try to login to Omnia using SSH and start the following commands:
ogghi
April 14, 2020, 6:58pm
3
Hi there, thanks for the feedback. I don’t get any feedback on those commands. Also there is no status command?
If I try /etc/init.d/luci_statistics reload:
And /etc/init.d/collectd reload the same result…
Skippi
April 14, 2020, 7:53pm
4
You can create missing directory using command:
and “reload” again.
ogghi
April 14, 2020, 8:07pm
5
Thanks a bunch Skippi!


