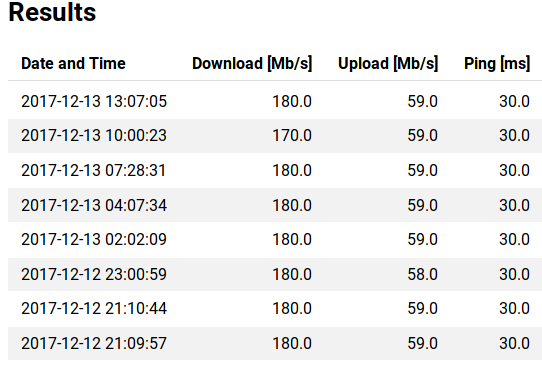
I have enabled Netmetr to run every few hour since 3.9 release. It works fine but I am a little sceptical with download results.
As you can see, I always get about 180Mbits/s. If I test with speedtest on the cli from one of the computer connected to the Turris I get about 400Mbit/s and my theoretical download speed is 1000Mbit/s.
Is the Netmetr servers capped? What is the max bandwidth they can sustain?
Hello,
due to technical reasons, currently we can measure speed only up to 200 Mbps for now through Foris plugin Netmetr.
You can try it also directly on your computer on Netmetr.cz, where you should get the real (=uncapped) speed. (In your situation you should have 400 Mbits.)
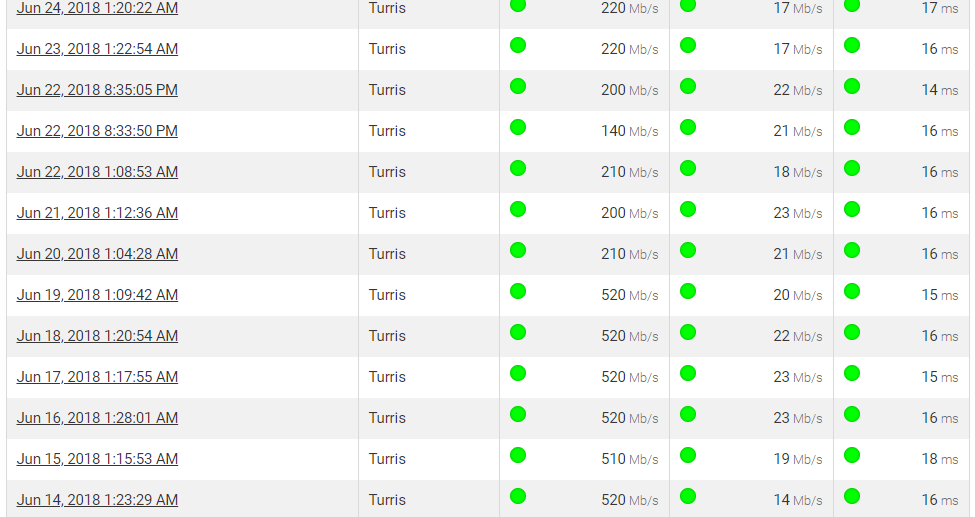
hello, this cap is limiting bandwidth measurements again since June 20 according to my measurements. Before June 20 i had 520 Mbits/s (my theoretical max download) and after June 20 it is down to 170-200 Mbits on the turris omnia, while measuring on the laptop connected to omnia it is 400+ Mbits
I’ve looked at my results, but I don’t see any downgrade. Anyway, I’ll rather ask my colleagues, if they have some issue. In the meantime would you please try it on e.g. SpeedTest.net and compare your results?
I have tested tonight some more.
These were done few seconds from each other.
As you see, the netmetr command line is capping almost exactly at 200 megabits.
I did some more in the afternoon and this 200 megabit looks like a wall that it cant break.
The laptop and speedtest.net gives various results around 270-300 megabits.
speedtest - Prague test server from the router
root@turris:~# speedtest --server 4162
Retrieving speedtest.net configuration...
Testing from Magyar Telekom (46.139.86.XXX)...
Retrieving speedtest.net server list...
Retrieving information for the selected server...
Hosted by ISP Alliance a.s. (Prague) [446.36 km]: 43.521000000000001 ms
Testing download speed..........................................................                                                                                        ......................
Download: 323.57 Mbit/s
Testing upload speed............................................................                                                                                        ..........................................
Upload: 23.46 Mbit/s
netmetr from omnia command line:
root@turris:~# netmetr
Checking uuid on the control server...
Requesting test config from the control server...
Starting ping test...
ping_1_msec = 13.28
ping_2_msec = 19.30
ping_3_msec = 21.09
ping_4_msec = 15.25
ping_5_msec = 18.84
ping_6_msec = 17.45
ping_7_msec = 17.14
ping_8_msec = 21.82
ping_9_msec = 20.38
ping_10_msec = 15.64
Starting speed test...
==== rmbt v3.6-1092-gac0717d7f-dirty ====
connecting...
connected with 3 flow(s) for dl; 3 flow(s) for ul
pretest downlink start... (min 1s)
pretest downlink end.
rtt_tcp_payload start... (11 times)
rtt_tcp_payload end.
downlink test start... (5s)
downlink test end.
pretest uplink start... (min 1s)
pretest uplink end.
uplink test start... (5s)
uplink test end.
disconnecting.
dl_throughput_mbps = 198.134725
ul_throughput_mbps = 23.362009
Exiting.
speedtest Hungarian server from Omnia
root@turris:~# speedtest
Retrieving speedtest.net configuration...
Testing from Magyar Telekom (46.139.86.173)...
Retrieving speedtest.net server list...
Selecting best server based on ping...
Hosted by Telenor Hungary (Budapest) [2.50 km]: 13.904999999999999 ms
Testing download speed................................................................................
Download: 437.13 Mbit/s
Testing upload speed......................................................................................................
Upload: 23.87 Mbit/s
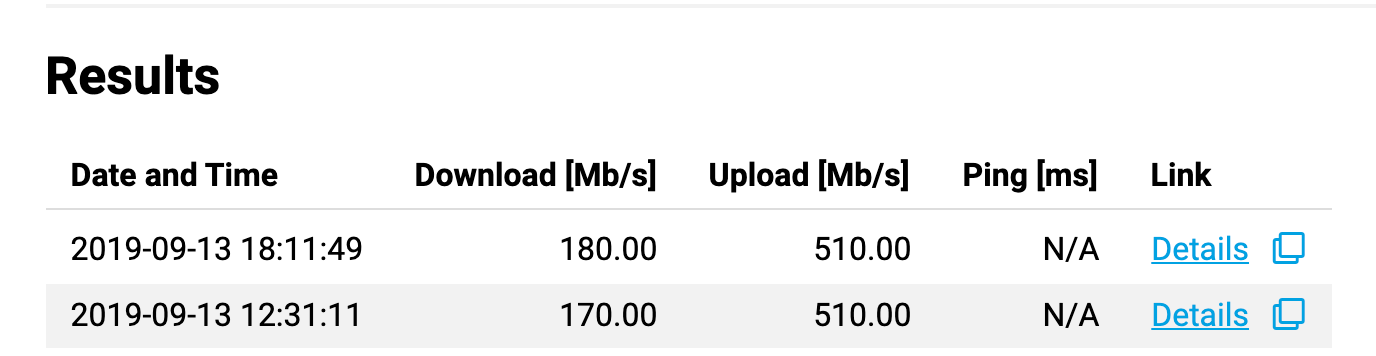
The Upload is back where it should be on Netmetr (60Mbps). But I still get slow results on Download.
~  speedtest
Retrieving speedtest.net configuration...
Testing from SFR (81.66.1XX.2XX)...
Retrieving speedtest.net server list...
Selecting best server based on ping...
Hosted by Orange (Paris) [7.22 km]: 38.685 ms
Testing download speed................................................................................
Download: 336.06 Mbit/s
Testing upload speed......................................................................................................
Upload: 59.87 Mbit/s
# netmetr
Checking uuid on the control server...
Requesting test config from the control server...
Starting ping test...
ping_1_msec = 37.54
ping_2_msec = 36.49
ping_3_msec = 36.54
ping_4_msec = 38.65
ping_5_msec = 37.40
ping_6_msec = 37.14
ping_7_msec = 37.26
ping_8_msec = 39.14
ping_9_msec = 37.64
ping_10_msec = 38.92
Starting speed test...
==== rmbt v3.6-729-g77afb9a02-dirty ====
connecting...
connected with 3 flow(s) for dl; 3 flow(s) for ul
pretest downlink start... (min 1s)
pretest downlink end.
rtt_tcp_payload start... (11 times)
rtt_tcp_payload end.
downlink test start... (5s)
downlink test end.
pretest uplink start... (min 1s)
pretest uplink end.
uplink test start... (5s)
uplink test end.
disconnecting.
dl_throughput_mbps = 96.624227
ul_throughput_mbps = 57.734548
Exiting.
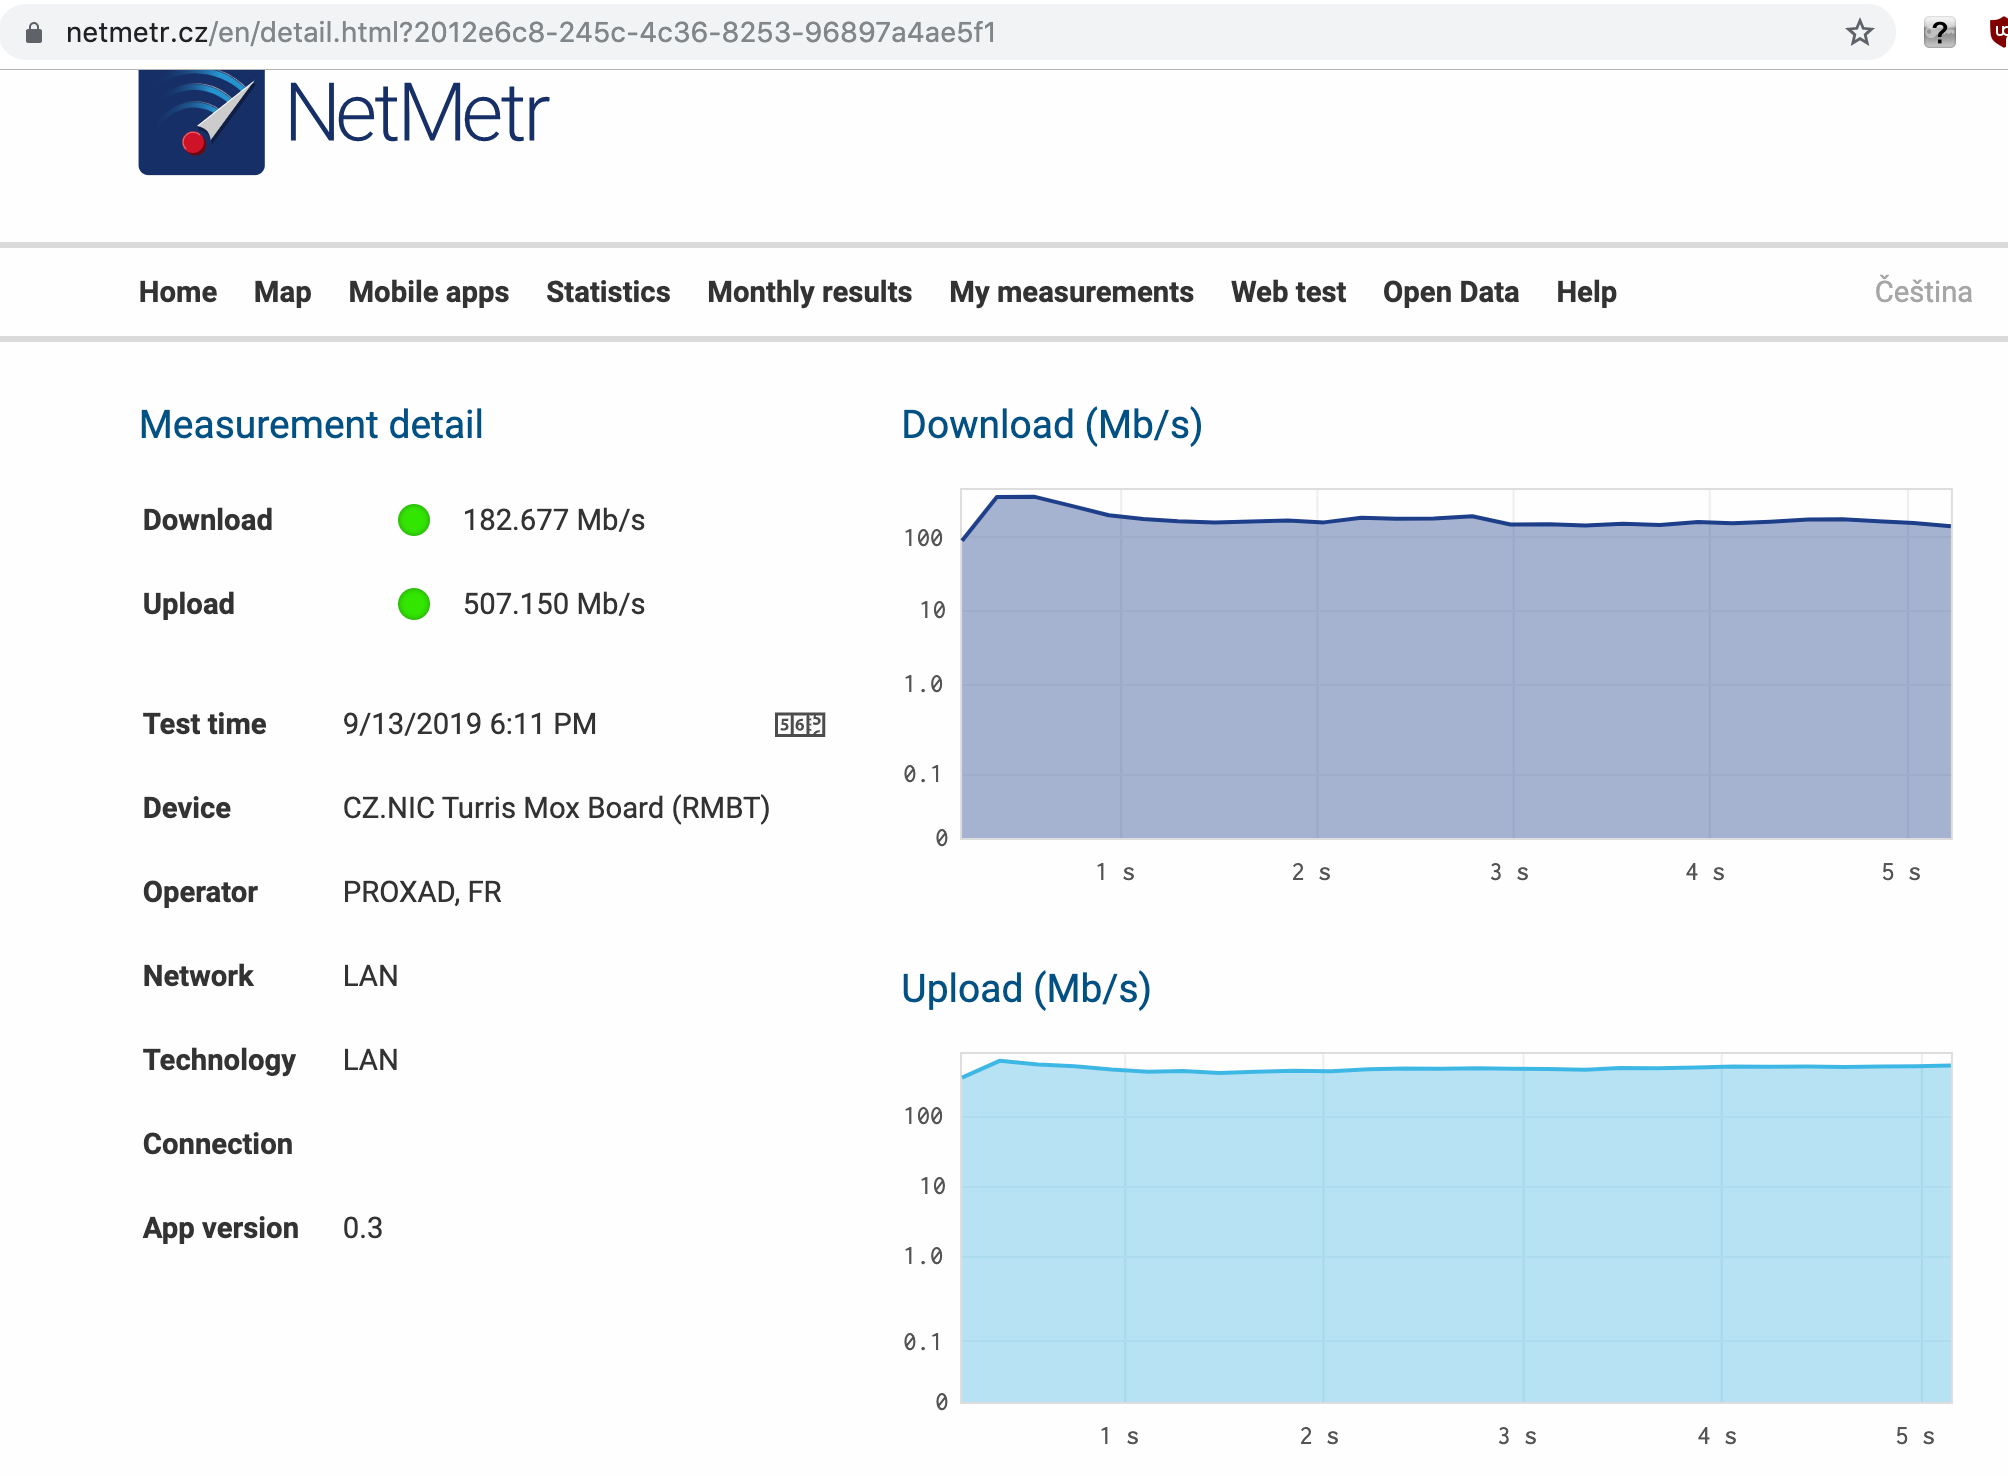
The Netmetr UI shows incoherent results. I am on a FTTU connection (Free, Paris) which normally should, according to speedtest.net, be around 500Mbit/s downstream and 200Mbit/s upstream. So first of all, question, could it be that up- and download- on the netmetr are seen “the other way round” ? I would have thought that a download is “down” from the network to me
Oh, I agree, a log scale, especially one based on powers of ten is not really helpful to appreciate either the variance or the magnitude of the data. One can sort of estimate the peak roughly, but that scale certainly magnifies the least interesting part of the data…