After 24 hours running default Omnia configuration + Majordomo (with database on external fast USB) free router’s memory is only 5%. Top shows strange multiple instances of foris with the high memory allocation. Is it normal?
> PID USER PRI NI VIRT RES SHR S CPU% MEM% TIME+ Command
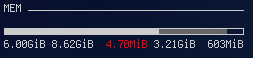
I’m not sure about buffers level. I used information from LuCI Status->Overview Total available and Free. Nevertheless 4% of free memory is really extreme…
I think that page uses free from system, at least when I dropped caches percentage of free memory jumped to be quite higher. So it might be just caches.
I can confirm that memory tends to run out quickly, however, I would not call it memory leak. It is just a default caching setting for OpenWrt. I also get about 5% left when copying something from the USB HDD attached to Omnia.
but he’s not trying" to make a point"… this is a question people are asking for many many years, it’s just nice to point them to a webite instead of having to explain it over and over again
and there are more webites like this
It seems to me that every Sunday at 2:00 a.m. (UTC+1) something changes the memory use. See my rrd charts. In the day graph is wisible that 2:00 is quite sharp, in the weekly graph is visible the regularity.
There is nothing in cron.
There is a cron at 02:05 on sunday: schnapps cleanup --compare.
It compares different snapshots of the filesystem for changes using file compare. This explains the cached memory rise.
I’ll find out which process (if any) it is.
Anyway, this is one of the concerns I have, the other are related to the segmentation faults on software install attempts.
It doesn’t look like any process is consuming all that memory. I still think it’s strange the memory usage is reported this way. I’m assuming it’s something internal to OpenWRT.


 Its older Turris cache hide from luci page?